
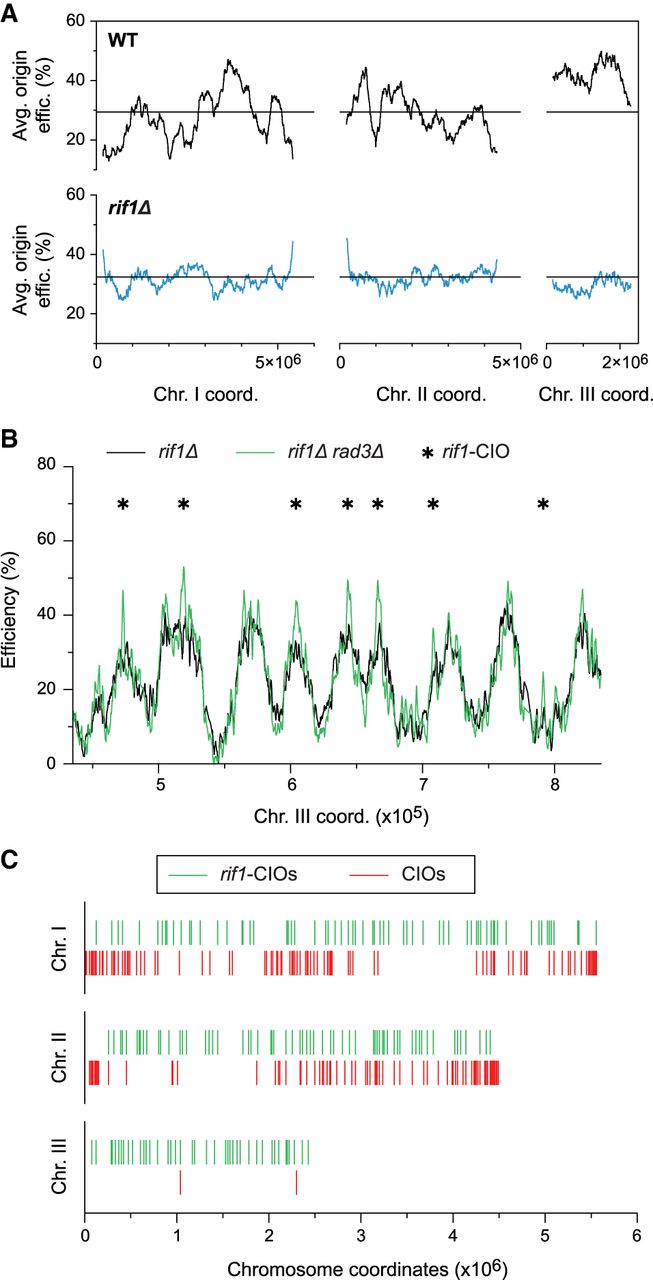
Modulation of the replication program results in redistribution of de-regulated origins. (A) Profiles of replication efficiency domains in cdc25-22 (WT, black, as in Fig. 1C) and cdc25-22 rif1Δ (rif1Δ, blue) cells. Cells were arrested in G2 and released to undergo S phase in 6 mM HU. The averages of origin efficiencies in each background were assessed for continuous 1000-probe windows. Horizontal lines: average origin efficiency genome-wide. x-axis: chromosome coordinates; y-axes: average origin efficiencies. The full maps of origin usage are shown in Supplemental Figure S5B. (B) Origin efficiencies in a representative region of the genome for rif1Δ (black) and rif1Δ rad3Δ (green) cells synchronized in G2 using the cdc25-22 mutation and released into 6 mM HU. Asterisks: rif1-CIOs. Full efficiency maps are in Supplemental Figure S5C. x-axis: chromosome coordinates; y-axis: origin efficiencies. (C) Comparison of the distribution of de-regulated origins: rif1-CIOs (rif1Δ rad3Δ, green bars) vs. CIOs (rad3Δ, red bars). x-axis: chromosome coordinates.


