
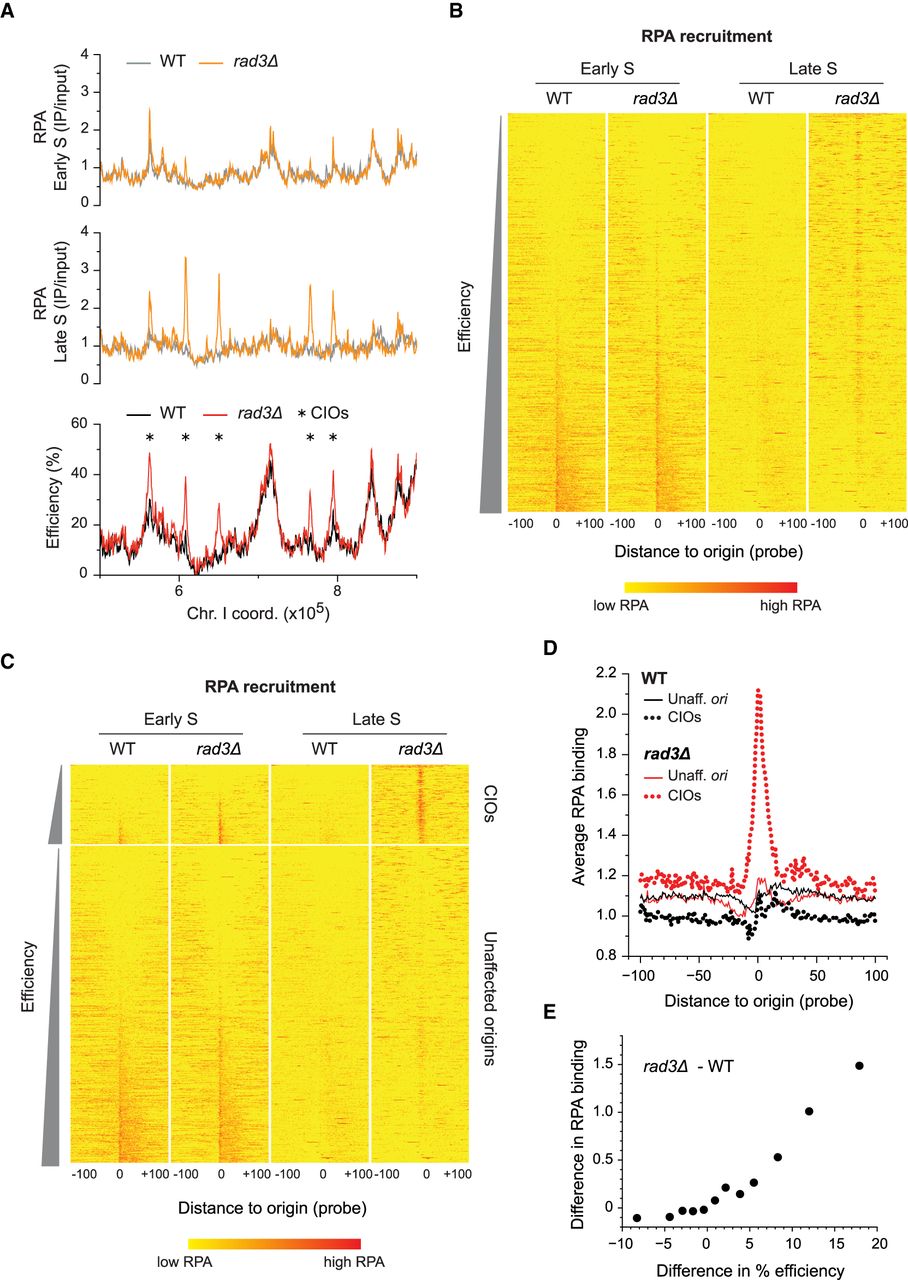
Abnormal accumulation of ssDNA at de-regulated origins. (A) Profiles of RPA binding and origin usage in a representative region of the genome. Full RPA and origin profiles are in Supplemental Figure S2B. Top and middle: RPA recruitment in early (60 min, top) and late (80 min, middle) S phase in wild type (WT, gray) and rad3Δ (orange). y-axis: RPA binding (IP/input). Bottom: origin efficiencies for WT (black) and rad3Δ (red). Asterisks mark CIOs. y-axis: origin efficiency. x-axis for all panels: chromosome coordinates. (B) Heat maps of RPA recruitment at origins in HU-treated wild-type and rad3Δ cells in early and late S phase. Data are from ChIP-chip experiments in A and Supplemental Figure S2B. All origins are shown in order of increasing efficiency; the most efficient origins are at the bottom of the plot. Position 0: central probe for each origin; values in a window of 100 probes on either side of each origin are displayed. A more intense red represents a higher level of RPA binding. (C) Heat maps of RPA recruitment, with origins divided into two categories: unaffected origins and CIOs (data are the same as in B). Origins in each category are displayed according to their efficiencies. Probe positions and color codes are as in B. (D) Average signal plots of RPA binding at origins in HU. Each line represents average RPA binding at either unaffected origins (solid lines) or CIOs (dotted lines) in wild-type (black) and rad3Δ (red) cells. Position 0: central probe for each origin; values at each probe position in a 100-probe window on either side of each origin were averaged for all origins in a category. (E) Correlation between the differences in RPA binding and in origin usage between rad3Δ and wild type. Origins were divided into 12 equal subsets (73 origins/group) based on the changes in their efficiencies (rad3Δ – WT). The average differences in efficiency (x-axis) and RPA occupancy (y-axis) for each group are shown. The nonaveraged data are shown in Supplemental Figure S2E.


