
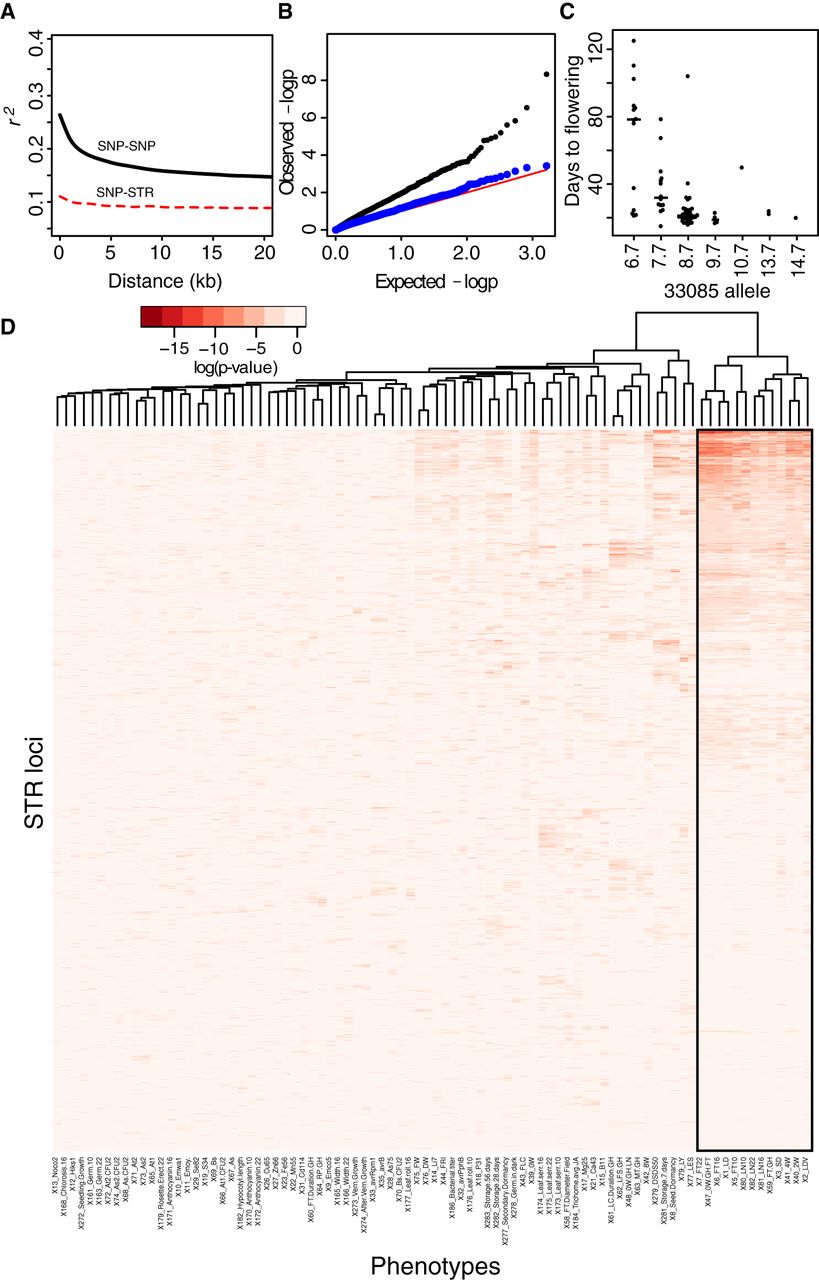
Diverse associations of STRs with quantitative phenotypes. (A) Multiallelic LD (Zaykin et al. 2008) estimates for STR and SNP loci. Lowess lines for each category are plotted. All values of r2 < 0.05 are omitted from lowess calculation for visualization purposes. (B) Quantile–quantile plot of P-values from tests of association between STRs and germination rate after 28 d of storage. (C) An example association between an STR (33085) and a phenotype (flowering time in long days after 4 wk vernalization) in A. thaliana strains. Median of each distribution is indicated by a bar proportional in width to the number of observations. (D) Heatmap showing pairwise associations between STRs and phenotypes, summarized by the P-value from a linear mixed model, fitting STR allele as a fixed effect and kinship as a random effect. Both rows and columns are clustered, although the row dendrogram was omitted for clarity. STRs with genotype information in fewer than 25 strains are not displayed. Flowering time phenotypes are boxed in black.


