
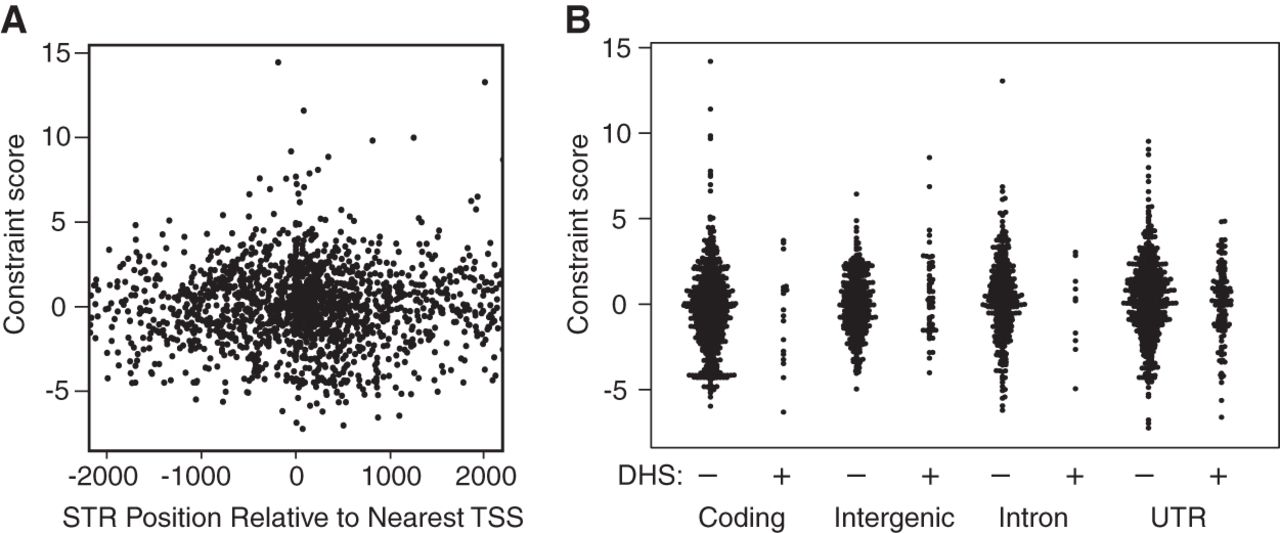
Figure 5.
Relationship of STR constraint to putative gene regulatory elements. (A) Constraint score from Figure 3B plotted with respect to nearest TSS. (B) Constraint score from Figure 3B plotted with respect to STR annotations and presence of (putatively regulatory) DNase I hypersensitive sites (DHS).


