
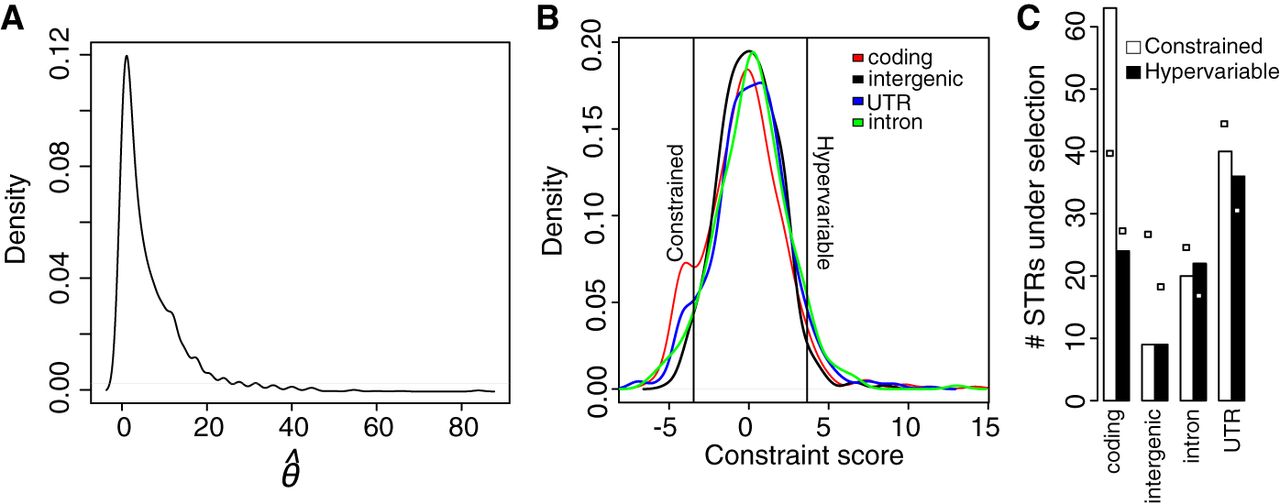
Detecting functionally constrained STRs. (A) The distribution of  (Watterson's estimator, or estimated population mutation rate) (Haasl and Payseur 2010) across all genotyped STR loci. (B) Distribution of “selection scores” across all STRs, separated by locus category. Vertical lines indicate 2.5% and 97.5%
quantiles of the distribution of intergenic STRs, which are used as thresholds for putative constraint and hypervariability,
respectively. (C) STRs under selection, e.g., constrained or hypervariable STRs, separated by locus category. White boxes indicate the expected
numbers for each bar, based on number of STRs in each locus category and number of STRs under different types of selection.
(Watterson's estimator, or estimated population mutation rate) (Haasl and Payseur 2010) across all genotyped STR loci. (B) Distribution of “selection scores” across all STRs, separated by locus category. Vertical lines indicate 2.5% and 97.5%
quantiles of the distribution of intergenic STRs, which are used as thresholds for putative constraint and hypervariability,
respectively. (C) STRs under selection, e.g., constrained or hypervariable STRs, separated by locus category. White boxes indicate the expected
numbers for each bar, based on number of STRs in each locus category and number of STRs under different types of selection.


