
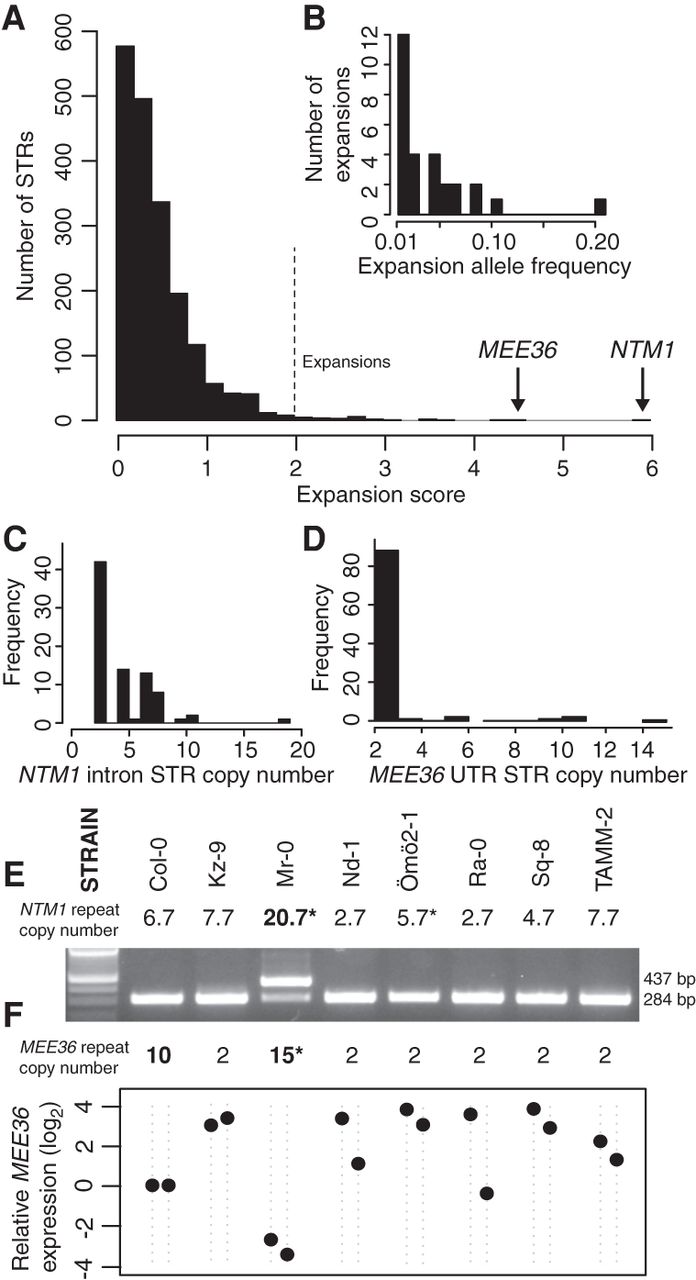
Inferring and assessing the functional effects of modest STR expansions. (A) The distribution of expansion scores across STRs, where the expansion score is computed as [max(STR length) – median(STR length)]/median STR length. We called any STRs with a score >2 a modest expansion (indicated). (B) Distribution of allele frequencies of the 28 expanded STR alleles. (C,D) Distribution of STR copy number of the intronic STR (motif CAA) in the NTM1 gene and the 3′ UTR STR (motif AT) in the MEE36 gene. (E) RT-PCR demonstrates intron retention in NTM1 mRNA in the Mr-0 strain, which carries the STR expansion, yielding an aberrant 437-bp product. (F) MEE36 transcript abundances measured by qRT-PCR and normalized relative to UBC21 transcript levels. For each strain, two independent biological replicates are shown as points. Transcript levels are expressed relative to Col-0 levels (set to 1). (*) STR genotype corrected by follow-up dideoxy sequencing. Strains and order are the same between E and F.


