
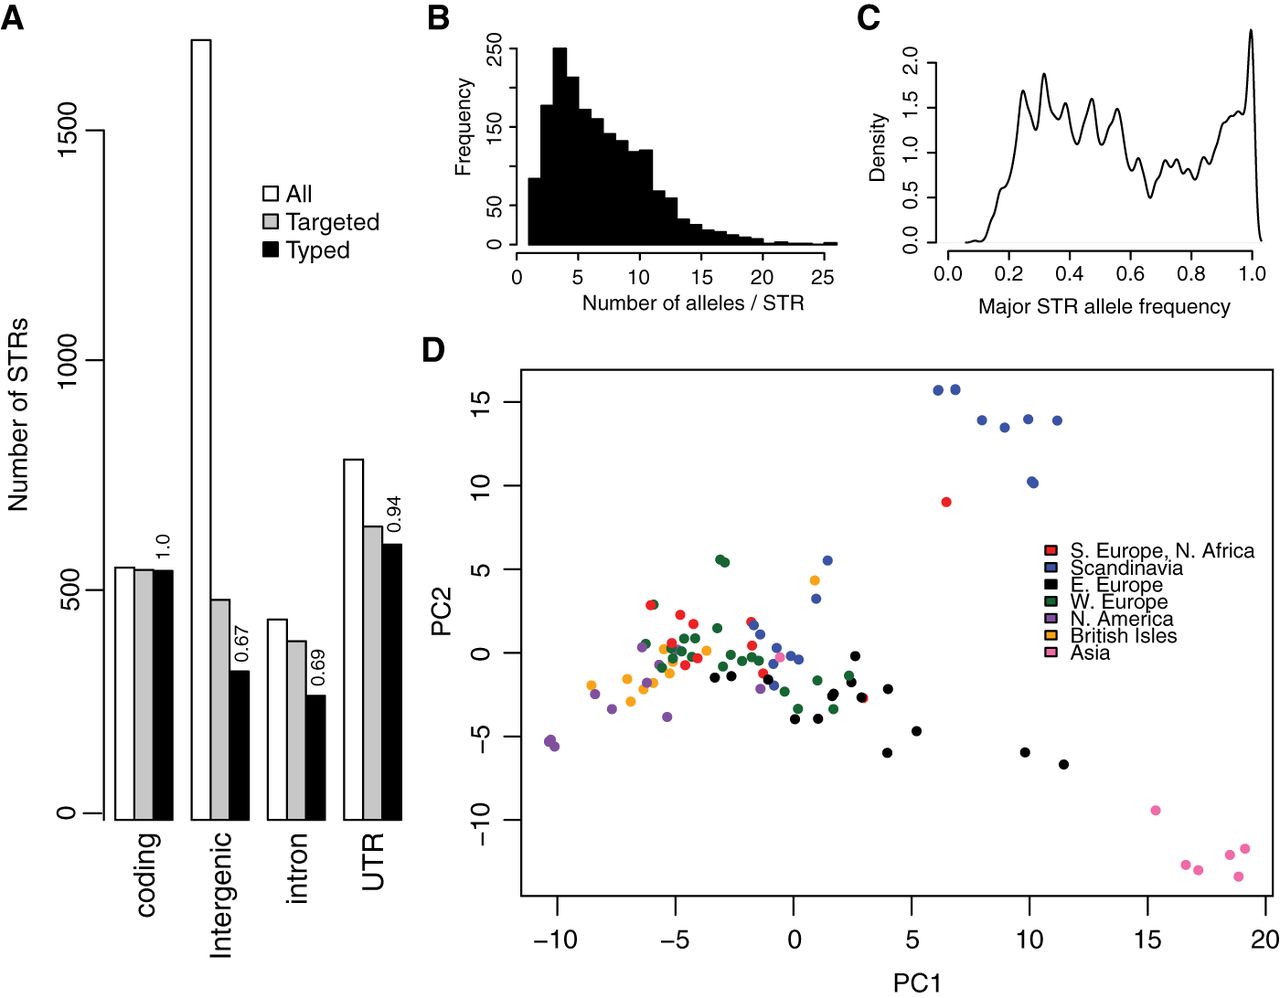
STRs in A. thaliana show a complex allele frequency distribution and geographic differentiation. (A) Distribution and ascertainment of STR loci. (All) All STRs matching the definition of STRs for this study, e.g., ≤200 bp length in TAIR10, ≥89% purity in TAIR10, 2–10 bp nucleotide motif. (Targeted) The 2046 STRs targeted for MIP capture. (Typed) STRs successfully genotyped in the Col-0 genome in a MIPSTR assay. Numbers above the bars indicate the proportion of targeted STRs in the relevant category that were successfully genotyped. (B) The distribution of allele counts across all genotyped STRs. (C) The distribution of major allele frequencies (frequency of the most frequent allele at each locus) across genotyped STRs. y-Axis is arbitrary units indicating density of loci showing the relevant frequency signature. (D) Principal component analysis (PCA) reveals substantial geographic structure according to STR variation. PC1 and PC2 correspond, respectively, to 5.2% and 4.0% of total STR allele variance.


