
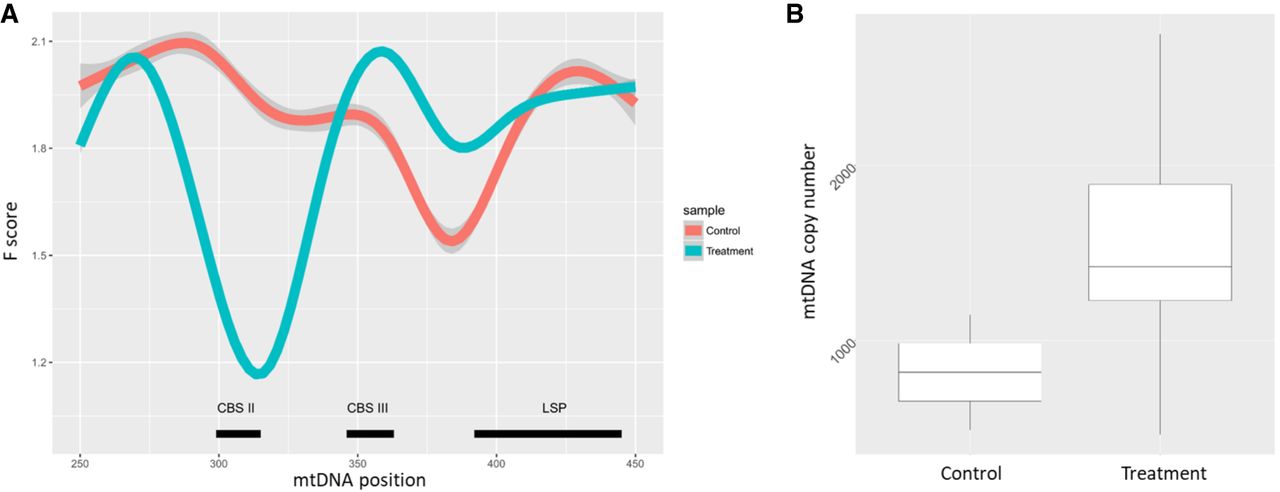
Figure 6.
Gain of mt-DGF site at the transcription-replication switch site, upon IL3-dependent activation of CD34+ cells. (A) Representation of the F-scores around the Light strand transcription start site: (y-axis) F-score; (x-axis) mtDNA position; (lowest F-score) most DNase I protected region; (thick line) average of F-scores across the analyzed samples; (dotted line) F-score calculated for single experiments; (red) control experiment; (gray) experiments of treated cells. (B) mtDNA copy number in control and treated cells.


