
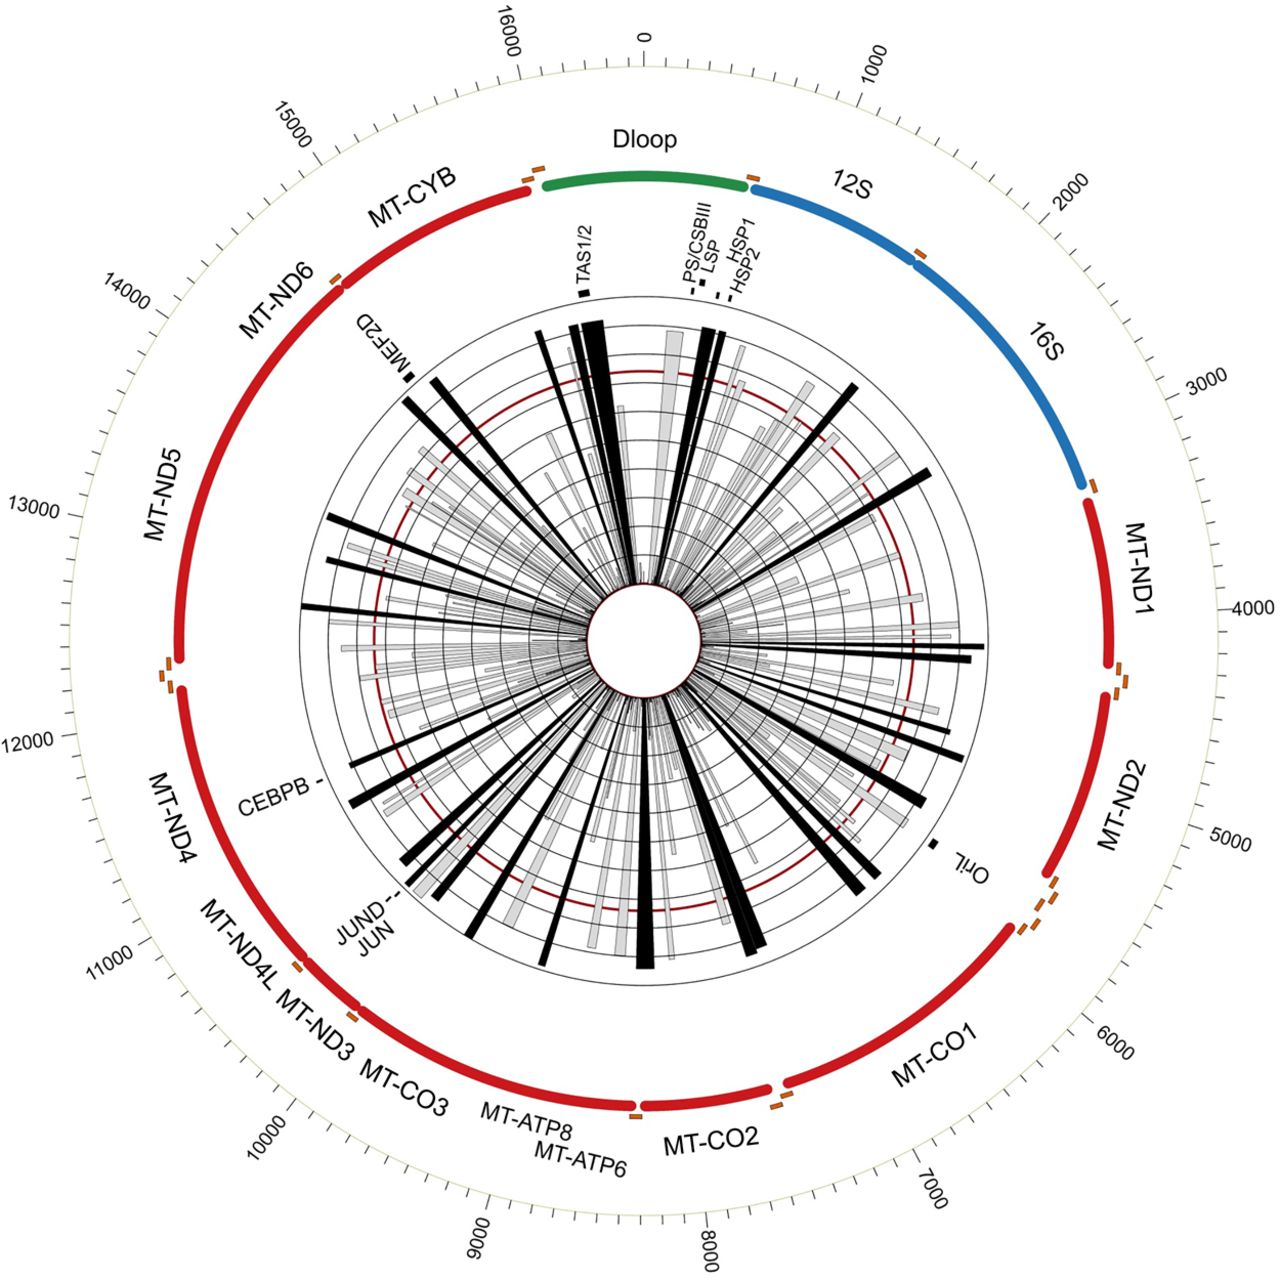
Figure 2.
Graphical overview of human mt-DGF sites. mtDNA location of all identified human mt-DGF sites (n = 246) according to their prevalence in the ENCODE sample collection. The inner ray histograms represent the prevalence of each site across ENCODE samples, with each concentric circle marking 10th percentile increments of the data set (from 0% to 100%). The red circle marks 74% of the samples, which refers to the average +1 SD of the samples tested. Black rays indicate the most prevalent mt-DGF sites. The mtDNA position of known regulatory elements and protein binding sites are indicated (JUN = cJUN).


