
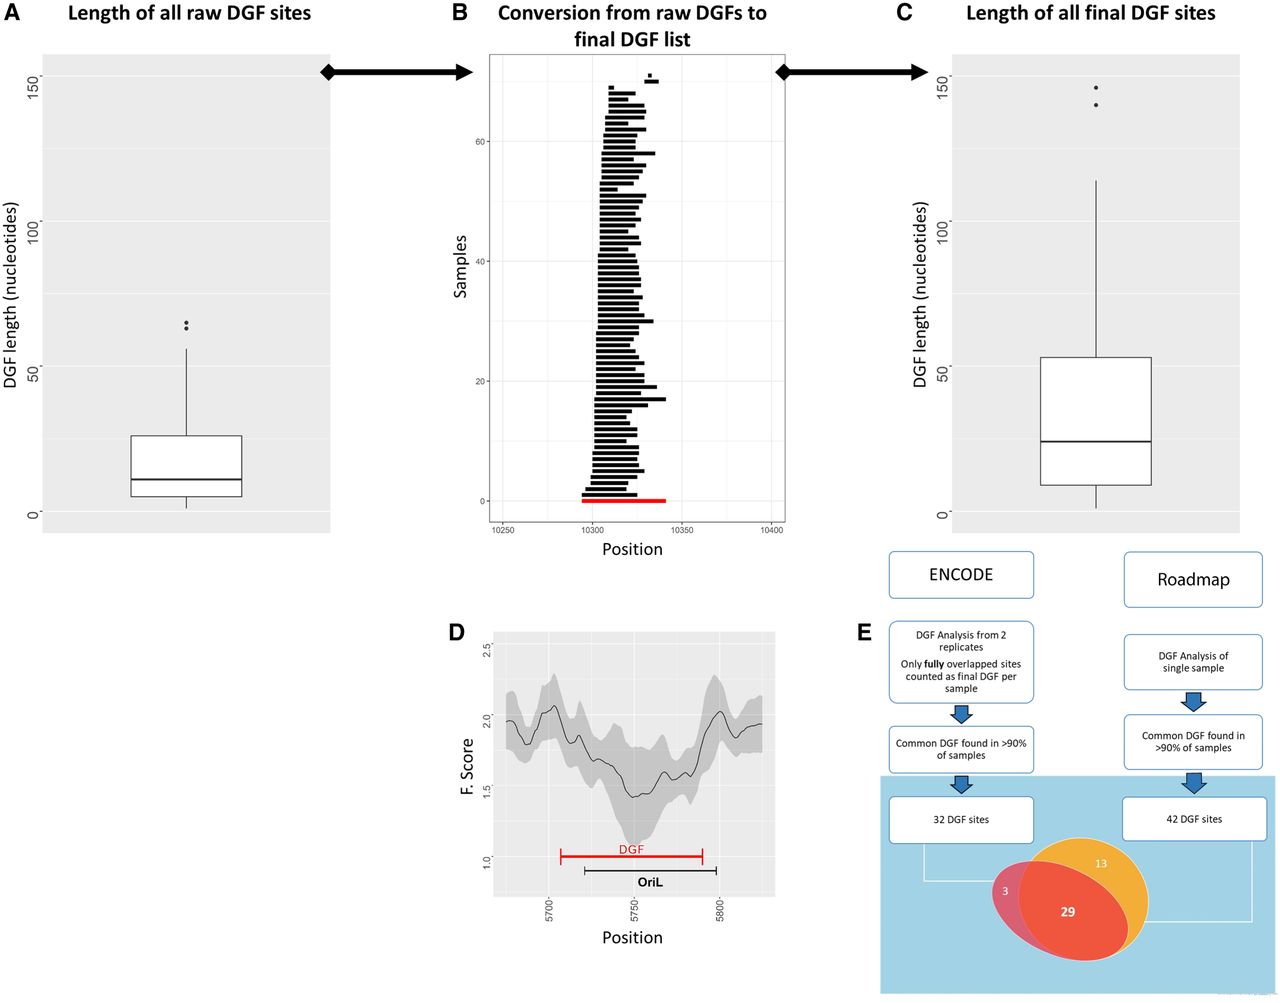
Flow of mt-DGF analysis. (A) Distribution of raw mt-DGF lengths calculated for ENCODE samples. y-Axis represents length of each mt-DGF in nucleotides. (B) Conversion of a representative mt-DGF site from raw mt-DGF site data (black lines) collected from all analyzed samples to the final listed mt-DGF site (red line). Notice that for each mt-DGF, overlapping raw mt-DGFs were combined in all analyzed samples (for ENCODE and Roadmap, separately); the length of each combined mt-DGF was between the 5′ and 3′ nucleotide positions of the most proximal and distal overlapping raw DGFs, respectively. (C) Length distribution (in nucleotides; y-axis) of all final (combined) mt-DGF sites. (D) F-score graph of a representative mt-DGF site, which overlaps a well-known regulatory element—the light strand origin of replication (OriL): (x-axis) mtDNA position; (y-axis) calculated F-score; (black curve) mean F-score values, surrounded by their calculated SD (gray area), based on all ENCODE samples. (E) A flow chart of our mt-DGF analysis. The Venn diagram shows the actual number of common mt-DGF sites (i.e., identified in at least 90% of the samples) in the ENCODE and Roadmap data sets. The number of common sites whose mtDNA location overlapped between the two data sets is indicated.


