
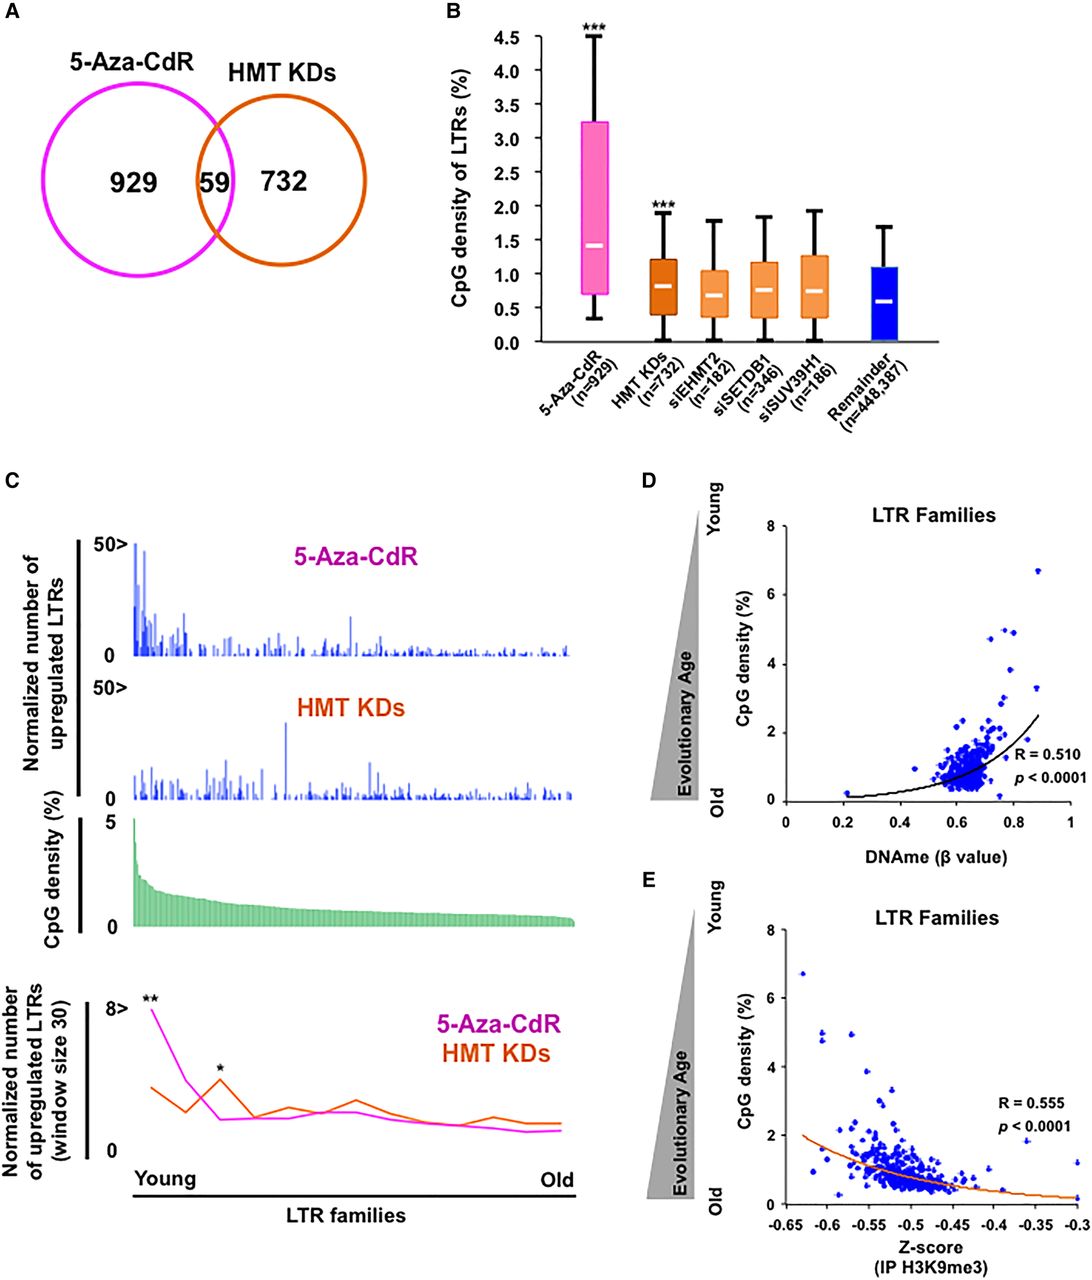
Silencing mechanisms of LTRs are switched in an age-dependent manner. (A) LTRs overlapping between up-regulated LTRs by 5-aza-CdR treatment and knockdown of histone methyltransferases (HMTs). (B) The distribution of CpG densities in up-regulated LTRs by 5-aza-CdR or HMT KDs. The boxes on 5-aza-CdR, HMT KDs, siEHMT2, siSETDB1, and siSUV39H1 indicate uniquely up-regulated LTRs in each group. “Remainder” refers to LTRs that were not up-regulated by any treatment. Each box represents the data between the 25th and 75th quartiles. The whiskers are drawn down to the 10th percentile and up to the 90th percentile. The differences between the 5-aza-CdR or HMT KDs groups and remainder are significant. P-values were calculated using Mann-Whitney U test: (***) P < 0.001. (C) The distribution of normalized number of up-regulated LTRs in each family. Blue bars indicate the number of up-regulated LTRs per 1000 LTRs in each LTR family (top). Green bars indicate average CpG density in each member in 368 LTR families (middle). Sliding window analysis represents the normalized number of up-regulated LTRs along CpG density (bottom); window size was 30 LTR families. P-values were calculated using the Wilcoxon signed-rank test for comparisons with the two groups: (*) P < 0.05; (**) P < 0.01. (D) The correlation between CpG density (evolutionary age) and DNA methylation of LTR families. (E) The correlation between CpG density (evolutionary age) and H3K9me3 of LTR families. Z-score values were calculated from RPKM based on ChIP-seq data in PBS and 5-aza-CdR-treated HCT116 (Fig. 5A).


