
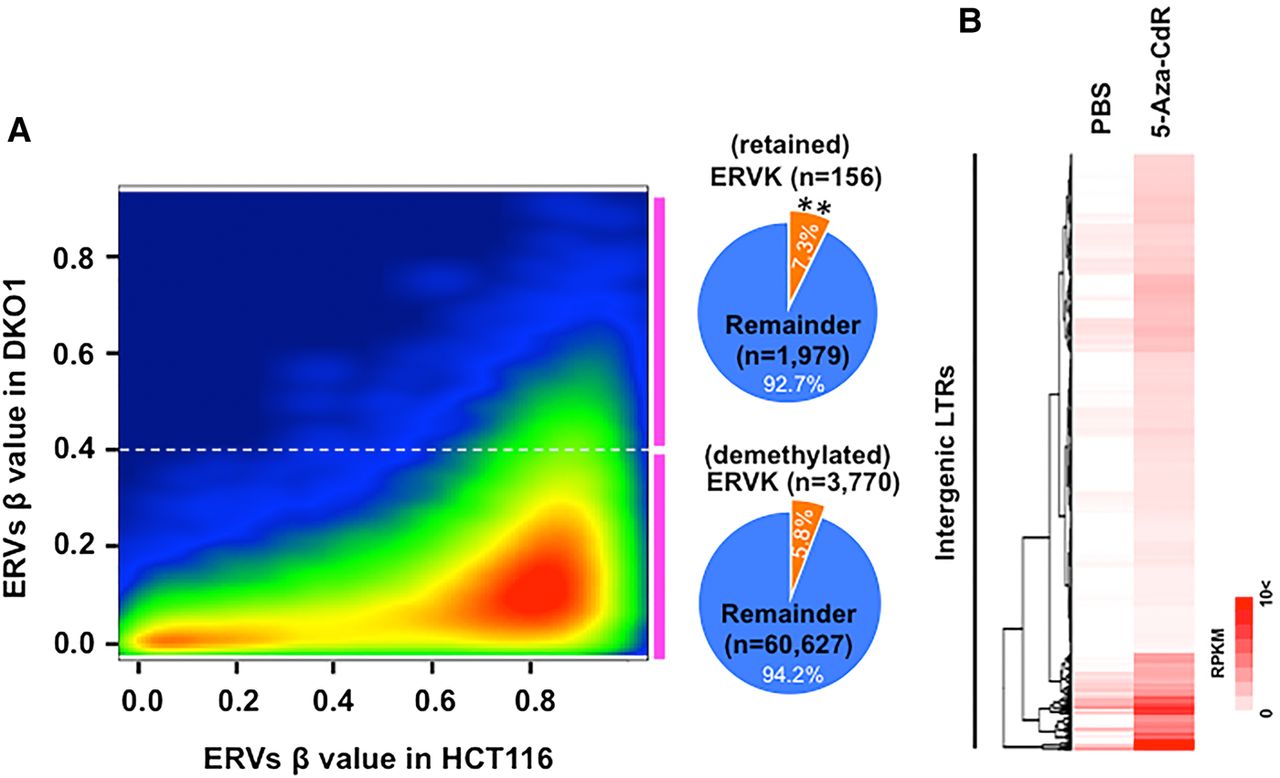
Expression of silenced intergenic LTRs can be induced by 5-aza-CdR in HCT116 cells. (A) A smoothing scatterplot showing the correlation between DNA methylation level of intergenic ERVs in HCT116 (x-axis) and DKO1 (y-axis) cell lines. The cold-to-warm color scale indicates a low-to-high density of intergenic ERVs. The dotted line represents the beta value of DNA methylation at 0.4 in DKO1. Each pie chart represents the percentage of ERVK in the two groups (retained: beta value ≥0.4, and demethylated: beta value <0.4). P-values were calculated using the χ2 test for comparisons with the two groups: (**) P < 0.01. (B) Heatmap showing the expression of up-regulated 988 intergenic LTRs after 5-aza-CdR treatment. Red indicates expression levels of LTRs from total RNA-seq in PBS or 5-aza-CdR-treated HCT116: (RPKM) reads per kb per million mapped reads.


