
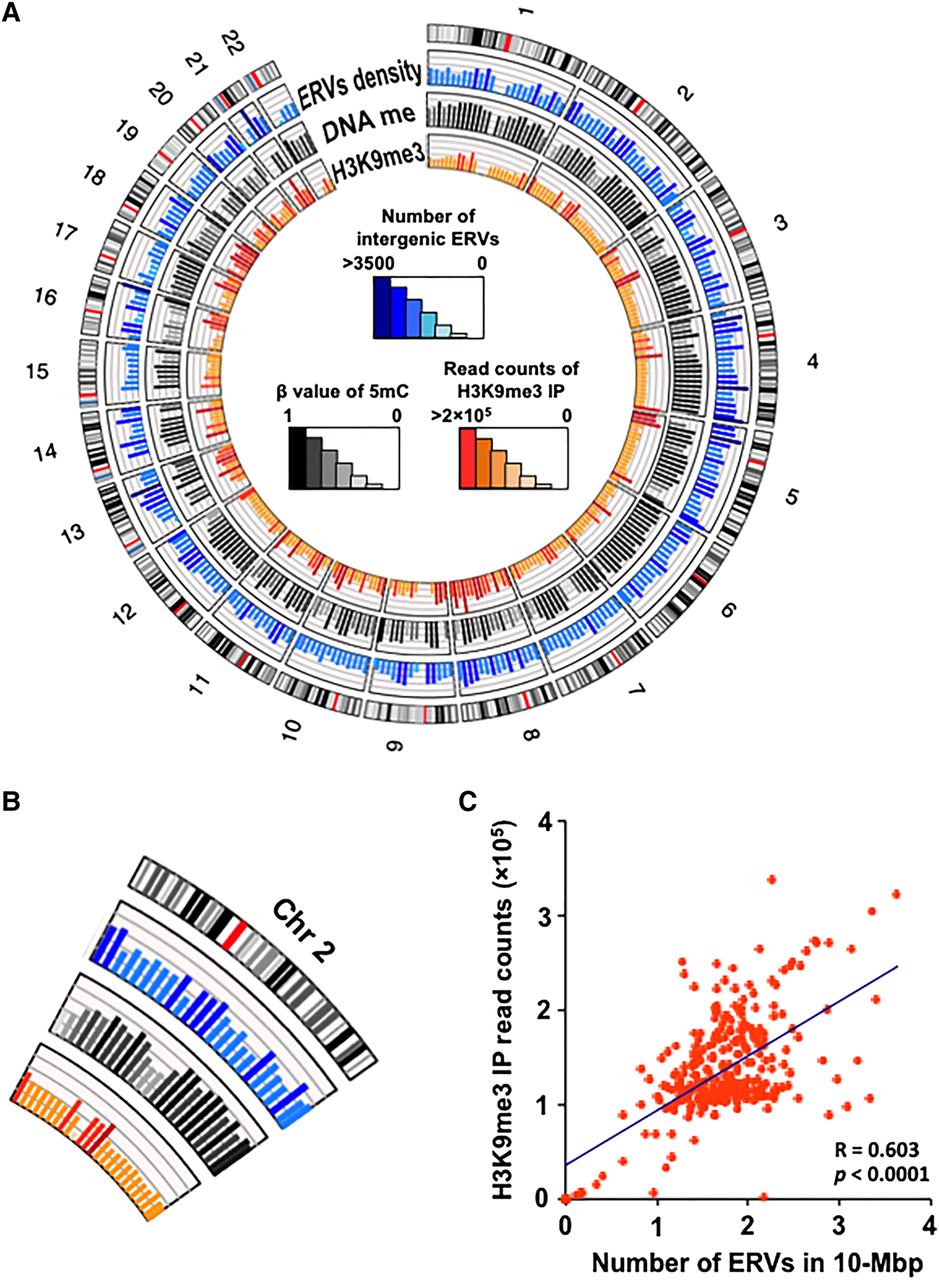
Genome-wide distribution of intergenic ERVs. (A) Circular genome mapping of ERV density, DNA methylation, and H3K9me3 (heterochromatin mark). The first track (outermost) represents the chromosome ideogram. Dark bands indicate heterochromatin regions, and red bands indicate centromeres. The second track represents the number of ERVs in each 10-Mb bin shown as histograms. The third track indicates beta values of DNA methylation of ERVs averaged in the bins, and the fourth track indicates the total read counts of H3K9me3 IP in the bins. In general, regions of high ERV density correlated with high levels of DNA methylation or heterochromatin marks. (B) Enlargement of Chromosome 2 in A. (C) Scatterplot represents the correlation between ERV density and enrichment of H3K9me3. The x-axis and y-axis correspond to the second and fourth tracks in A, respectively.


