
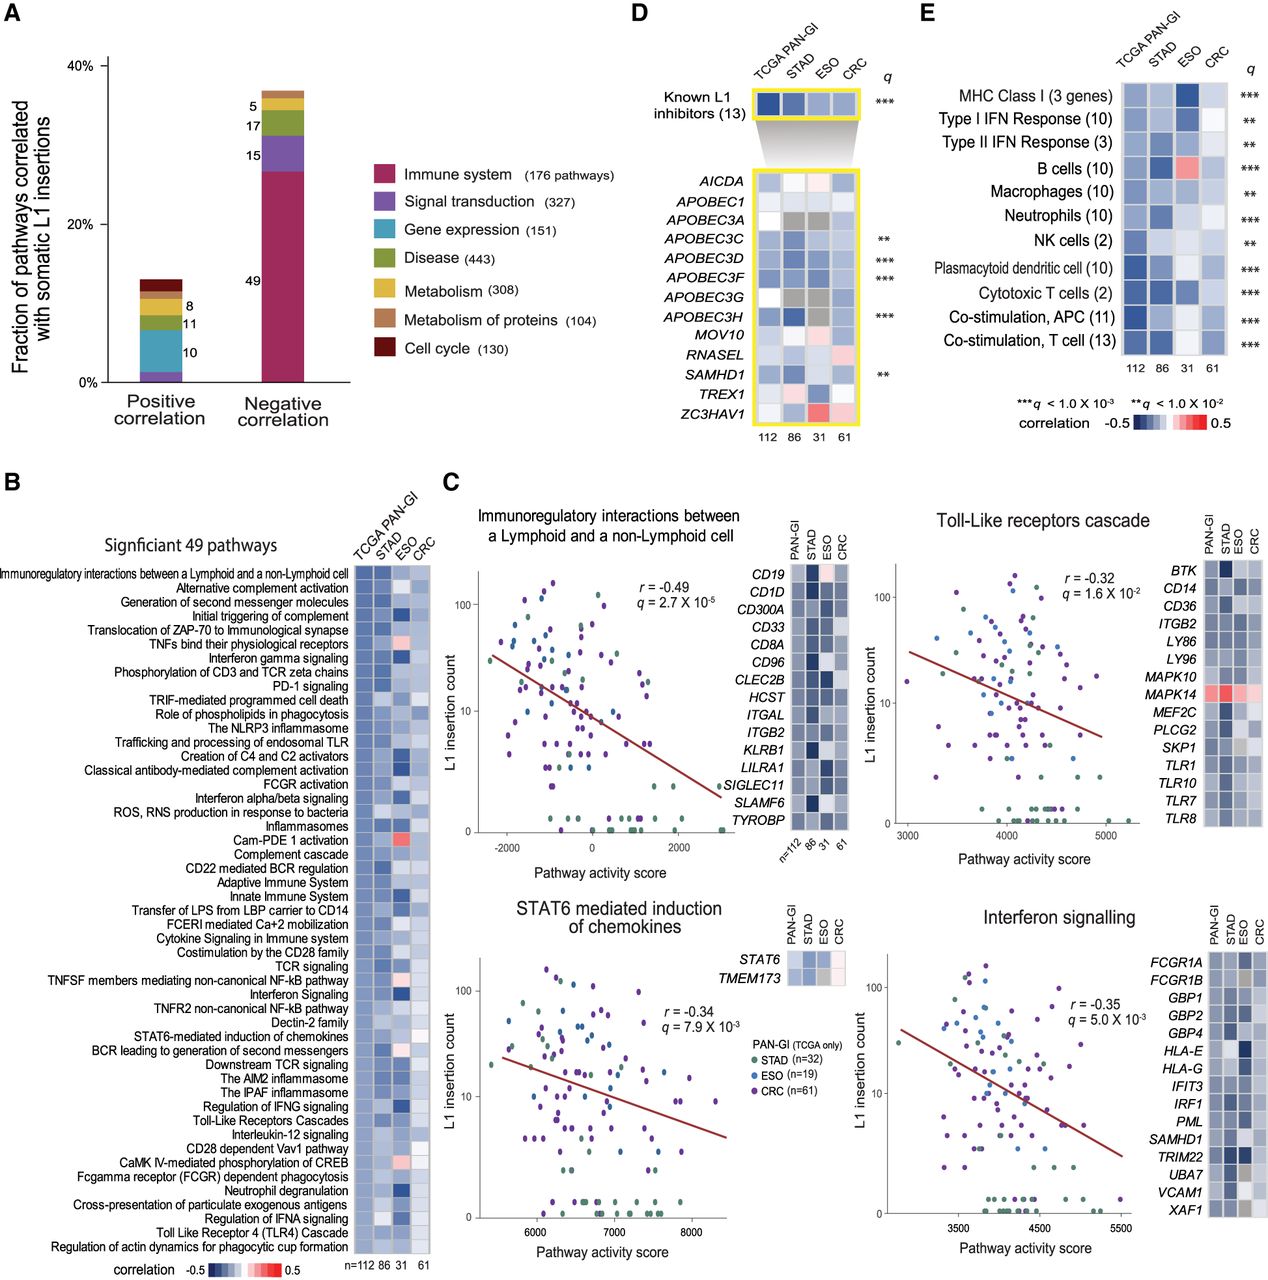
Immune activity associated with somatic L1 retrotransposition. (A) Reactome pathways for which activity correlates with somatic L1 insertion frequency. For each pathway category, the percentage of pathways showing a significant positive or negative correlation between pathway activity and somatic L1 insertion frequency (FDR < 0.05) is shown in a stacked bar. The number of significantly correlated pathways for each category is shown beside the stacked bar. The number of all member pathways for each category is shown in parentheses, and only the categories with more than 100 member pathways are shown. (B) Forty-nine immune pathways whose activity shows a significant negative correlation with L1 insertion frequency (FDR < 0.05). Each cell in the heatmap shows a color-scaled Spearman correlation coefficient between the activity of each immune pathway (row) and the frequency of somatic L1 insertions in cancer samples from each cancer type (column). (C) Examples of the significant immune pathways. The pathway activity score (x-axis) and L1 insertion count (y-axis) is marked with a colored dot for each cancer sample. Green, blue, and purple dots represent STAD, ESO, and CRC samples, respectively. The Spearman correlation coefficient and its P-value are shown. Key member genes whose expression levels were significantly correlated with insertion counts (FDR < 0.05) are shown in the heatmap. Each cell in the heatmap shows a color-scaled Spearman correlation coefficient between gene expression level and L1 insertion frequency. Up to 15 key genes are shown, ranked by the significance of the correlation. Key genes that are present in multiple pathways are shown once. (D) Correlation between the expression level of 13 known L1 inhibitors and the frequency of somatic L1 insertions. The top row of the heatmap shows the Spearman correlation coefficient between the activity of a gene set with 13 known inhibitors and L1 insertion frequency for each cancer type (column). The bottom rows of the heatmap show the coefficients for individual inhibitors (row). A row with a PAN-GI correlation of q < 0.01 and q < 0.001 (adjusted P-values combined across all cancer types using the Fisher's method) is marked with double and triple asterisks, respectively. (E) Various immune gene sets showing a negative correlation with L1 insertion frequency.


