
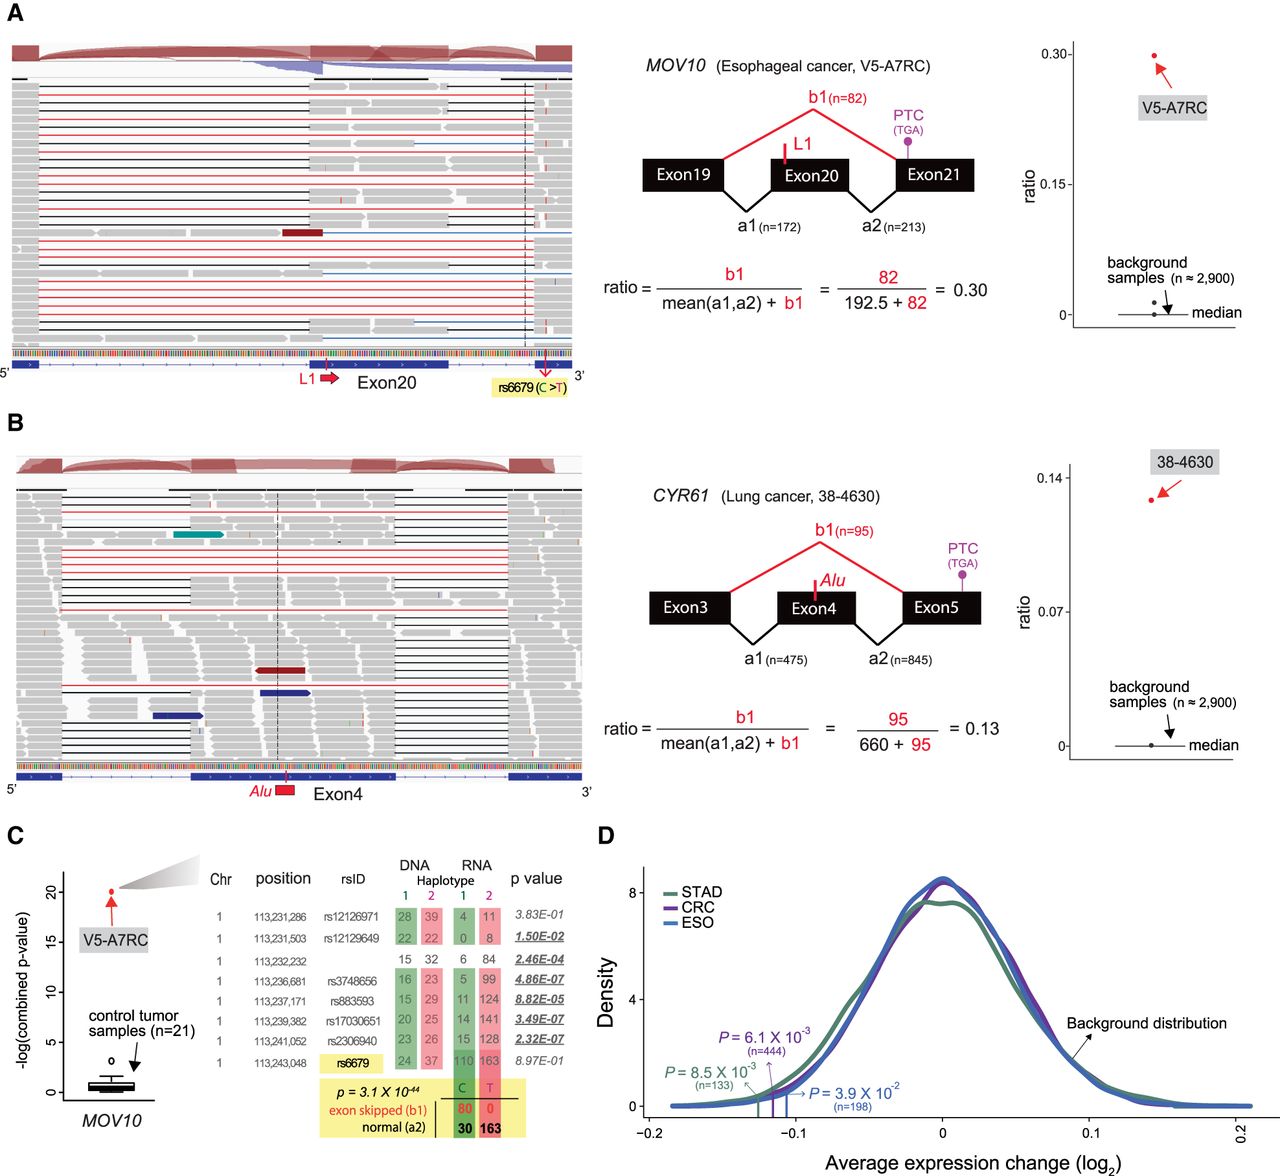
Disruption of mRNA splicing and expression by somatic L1 insertions. (A) Skipping of exon 20 in MOV10 caused by a somatic L1 insertion in a TCGA esophageal cancer sample. RNA-seq reads (gray boxes) from normally spliced transcripts show split mapping between the expected adjacent exons (black lines), whereas reads from transcripts with exon skipping show abnormal split mapping without the exon with the L1 insertion (red lines). Reads showing the exon skipping were spliced at the splice donor site of exon 19 and the splice acceptor site of exon 21. Other minor forms of abnormal splicing that involve retention of the nineteenth intron, partial skipping of exon 20, and/or skipping of exon 21 are also shown with blue lines. The schematic diagram in the middle shows how to calculate the ratio of the abnormally spliced read count (major form) to the total read count around the exon with the L1 insertion. The ratios are also calculated using approximately 2900 control RNA-seq profiles (cancer samples without any mutation in MOV10 and normal tissue samples) and serve as a background distribution to assess the significance of the observed ratio from the esophageal cancer sample (red dot). A heterozygous single-nucleotide variant (SNV; rs6679) in exon 21 shows a linkage with the exon skipping; reads with the alternative “T” allele (the lines shown in red within the reads) show normal splicing, and reads with the reference “C” allele show skipping of exon 20. This linkage is utilized to examine an allelic decrease of MOV10 expression in C. (B) Skipping of exon 4 in CYR61 caused by a somatic Alu insertion. Reads from the third and the fourth introns were often observed in the control RNA-seq profiles, suggesting that they were prespliced transcripts not associated with the Alu insertion. (C) Decreased expression of the MOV10 allele with exon skipping caused by a somatic L1 insertion shown in A. The esophageal cancer sample had eight heterozygous SNVs in MOV10. For each of the eight SNV loci, the number of reads with a reference allele and an alternative allele is shown for both whole-genome sequencing (DNA) and RNA-sequencing data. The colored boxes (red and green) around SNV read counts represent different haplotypes. The degree of allelic bias in RNA-sequencing data relative to DNA-sequencing data was tested using Fisher's exact test, and loci with significant bias (P < 0.05) are underlined in bold. On the left box plot, the combined P-value from eight loci in the esophageal cancer sample (red dot) is compared to the distribution of the combined P-values from 21 control cancer samples without any mutation or methylation aberration in MOV10 (black box plot). For the SNV (rs6679) with a linkage to the exon 20 skipping (A), the number of RNA-seq reads that span the SNV loci and show the splicing pattern is shown. Association between SNV alleles and exon skipping status was tested using Fisher's exact test. (D) Decreased expression of genes with somatic L1 insertions. The average difference for each cancer type is marked by a vertical line. The P-value of the observed average expression difference was calculated based on a background distribution estimated from random gene sets for each cancer type (colored curved line) (Methods). The number of genes with somatic L1 insertions for each cancer type is shown in parentheses.


