
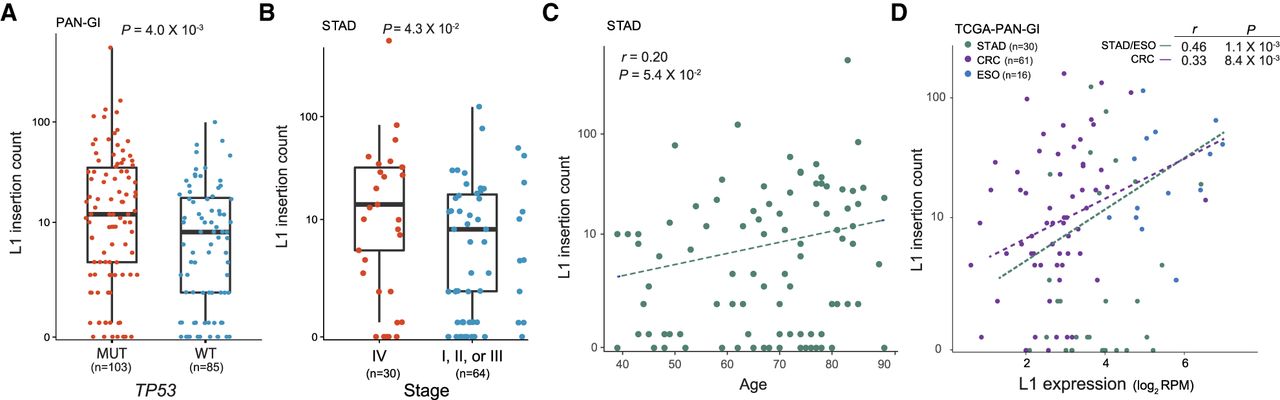
Factors correlated with the frequency of somatic L1 insertions. (A) Somatic L1 insertion counts in cancer samples with mutations (MUT, red dots) and without mutations (WT, blue dots) in TP53 are shown in box plots. (B) Somatic L1 insertion counts in stomach cancer samples at stage 4 (red dots) and at earlier stages (stages 1–3, blue dots) are shown in box plots. (A,B) P-values from the Mann-Whitney U test are shown. (C) Correlation between the age of cancer patients at diagnosis (x-axis) and somatic L1 insertion counts (y-axis) in stomach cancer. (D) Correlation between L1 expression (x-axis) and somatic L1 insertion counts (y-axis). (C,D) Spearman correlation coefficients and their P-values are shown.


