
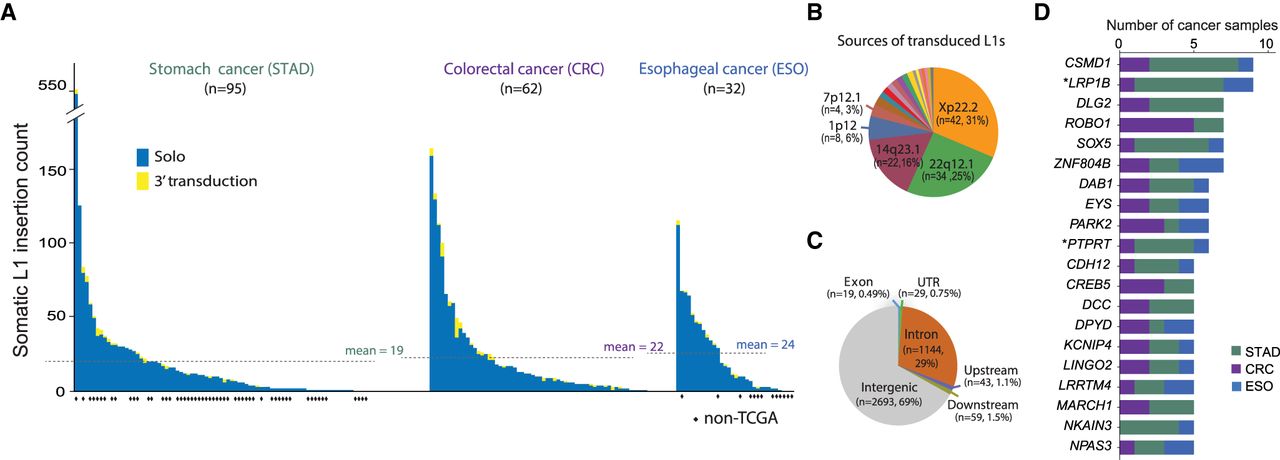
Figure 1.
Landscape of somatic L1 insertions in gastrointestinal cancers. (A) Frequency of somatic L1 insertions across three cancer types. The dotted line denotes the average insertion count for each cancer type. (B) Source L1 elements of somatic L1 insertions with 3′ transduction. (C) Genomic distribution of somatic L1 insertions. Upstream/downstream insertions are those that occur within 5 kb from the transcription start/end sites of genes. (D) Genes with recurrent somatic L1 insertions. Genes with insertions in more than four cancer patients are shown. (*) Known cancer genes reported in the COSMIC Cancer Gene Census database v82 (Forbes et al. 2017).


