
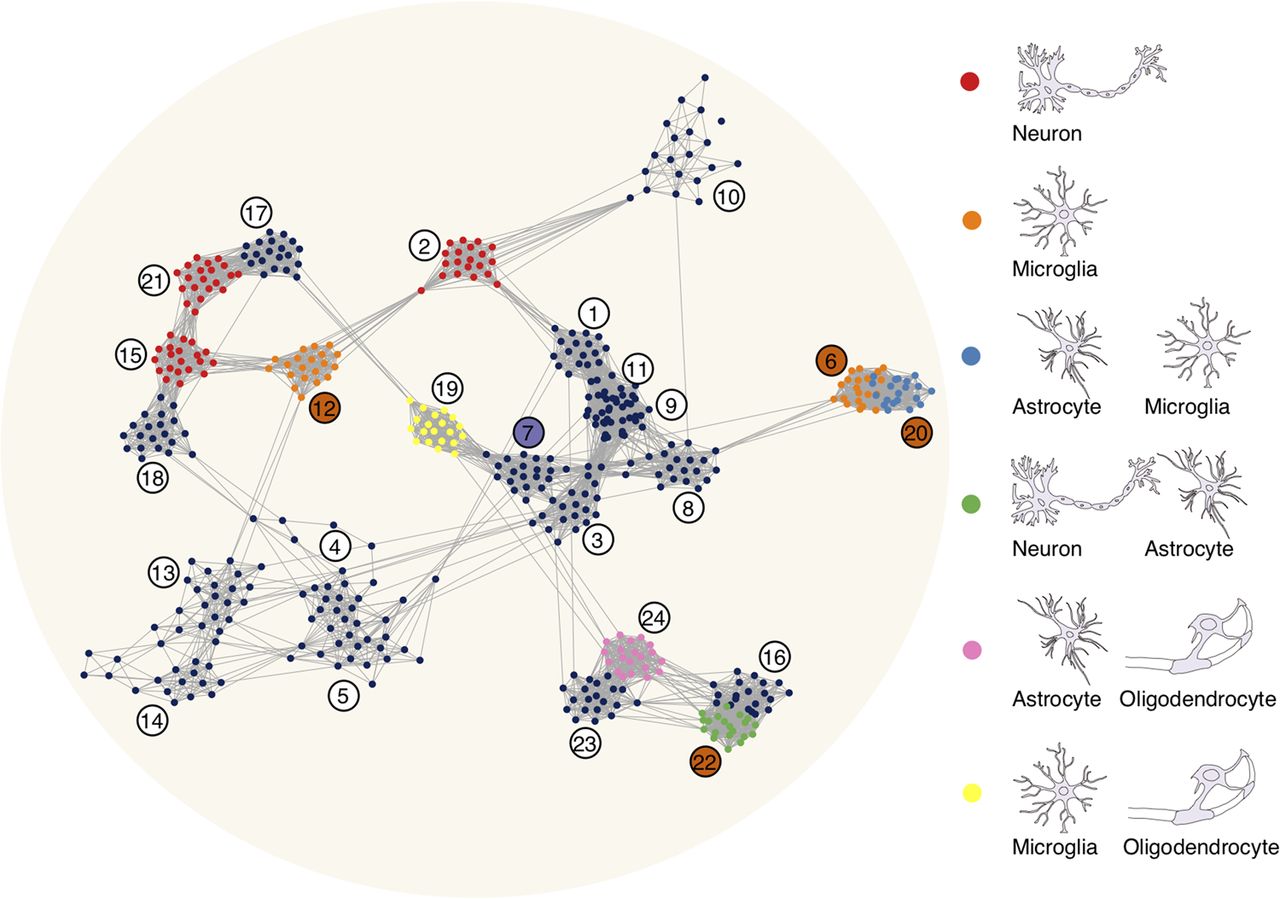
Figure 6.
Visualization of the 24 modules in the coexpression network. The nodes represent genes. For each module, the 20 genes best correlated within a module are drawn. The edges represent Pearson correlation coefficients >0.8. The colors of the nodes denote significant enrichment of genes from the corresponding module in cell-type markers, as illustrated by the graphical legend on the right. The colors of the module labels indicate species-specific modules: human (orange); chimpanzee (purple).


