
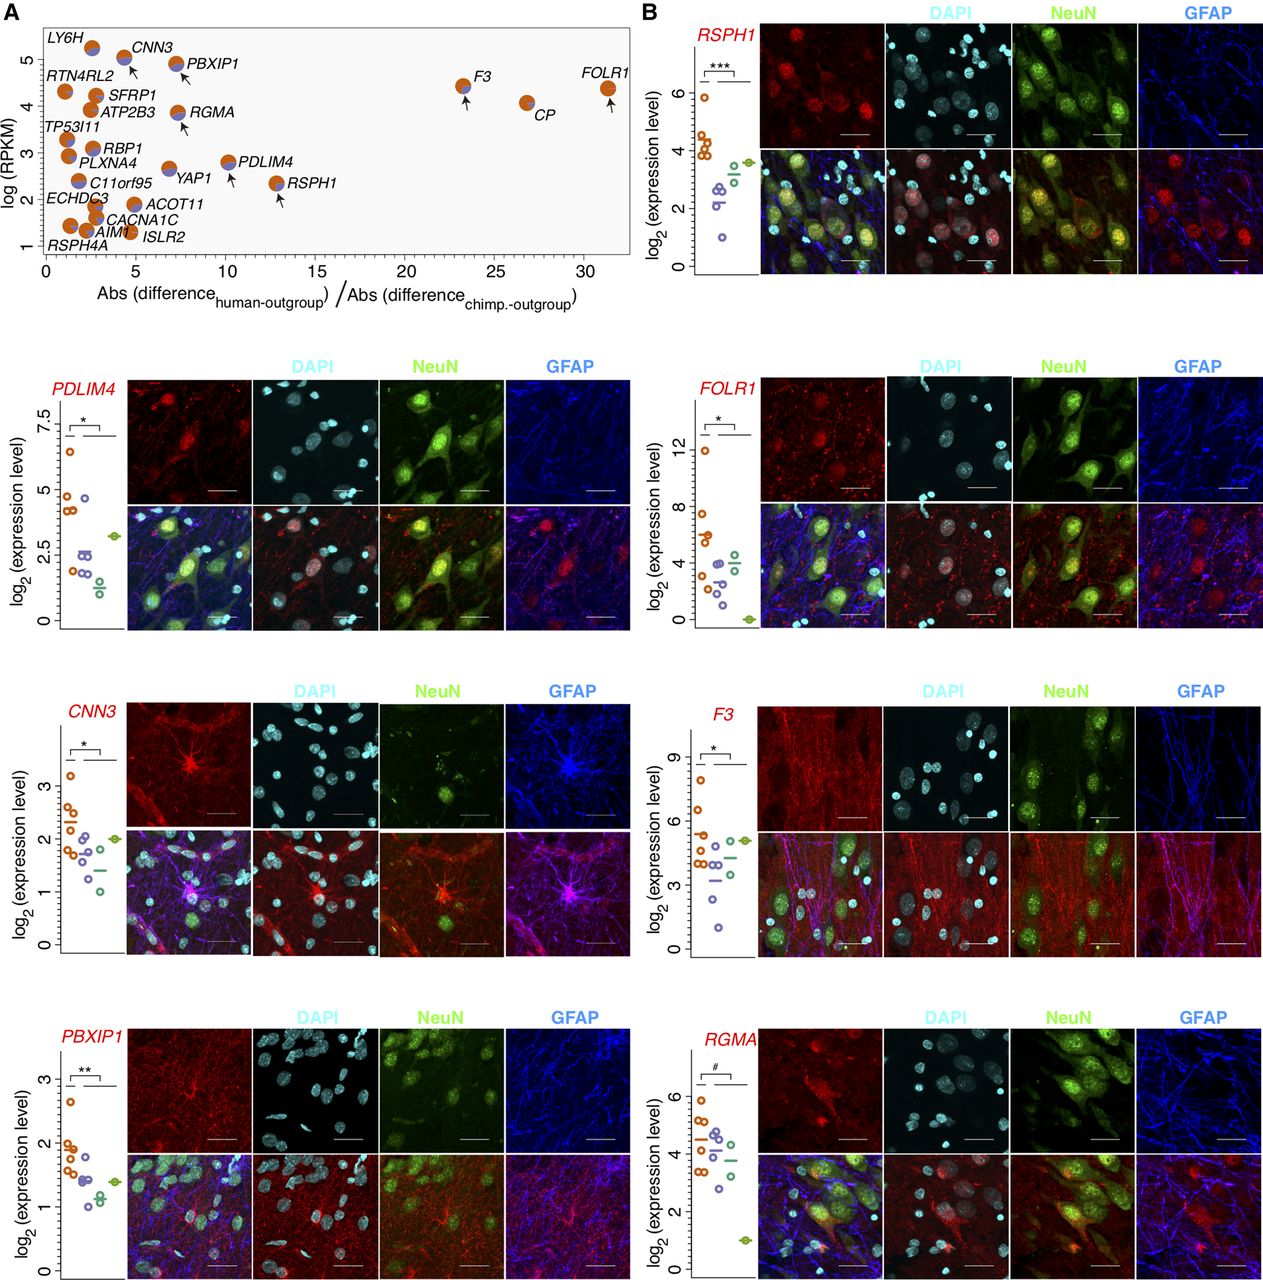
Human-specificity of module 22 genes in the hippocampus. (A) Scatter plot showing expression levels and human-specificity ratio calculated using combined outgroup data for a subset of 23 module 22 genes selected based on expression and cell-type–specificity information (Methods). Each gene is represented by a pie chart showing relative specificity of expression to the hippocampus, compared to the average expression across the rest of the brain regions, in humans (orange) and chimpanzees (purple). The arrows indicate seven genes measured in RT-qPCR and IHC experiments. (B) The expression and cellular localization of the seven selected genes with human-specific expression in the hippocampus. Each panel shows expression levels measured using RT-qPCR (left) and cellular localization in the human hippocampus determined using IHC (right). (Left) The log2-transformed expression levels are shown by colored symbols. Each symbol represents an individual (n = 6 for humans, n = 5 for chimpanzees, n = 2 for gorillas, and n = 1 for gibbon). The colors represent species: (orange) humans; (purple) chimpanzees; (dark green) gorillas; (light green) gibbon. The horizontal lines show the mean expression across biological replicates. The asterisks indicate the significance of expression differences between humans and the other three primate species in a one-sided Wilcoxon test: (***) P < 0.0005; (**) P < 0.005; (*) P < 0.05; (#) P = 0.1. (Right) The IHC images show the signals from the investigated protein (red), the general nuclear marker DAPI (light blue), the neuronal marker NeuN (green), the astrocytic marker GFAP (blue), as well as merged images (scale bar, 25 µm). The RSPH1, PDLIM4, FOLR1, and RGMA images were taken in the CA3, CNN3, and F3 images—in the CA1, PBXIP1 images—in the dentate gyrus.


