
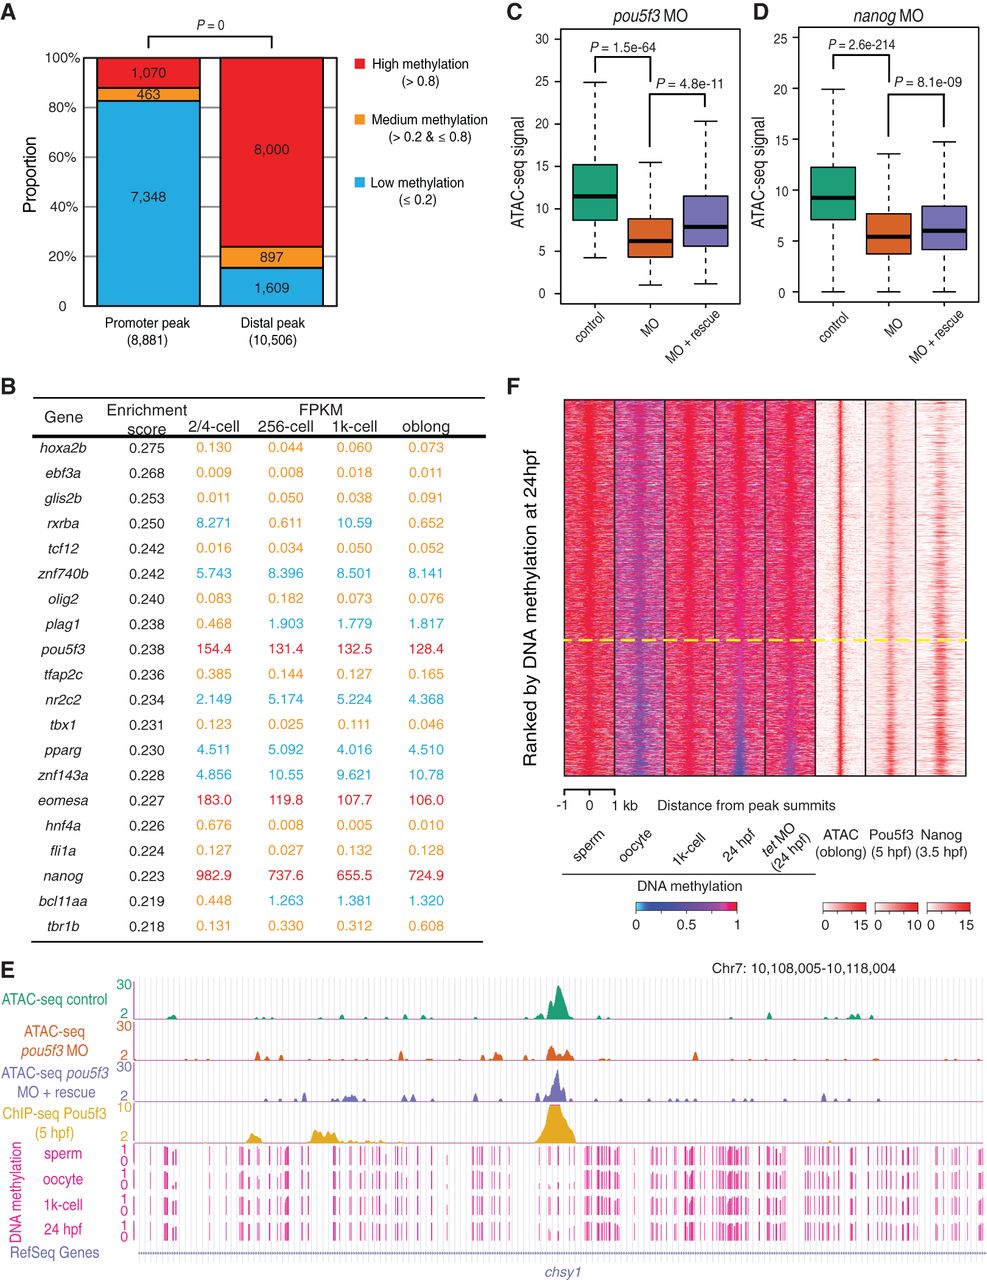
Transcription factors modulate accessible distal regions with high methylation levels. (A) The bar plot shows the proportion of newly accessible promoters and distal regions (at the 1k-cell and oblong stages) with high (>0.8), medium (>0.2 and ≤0.8), and low (≤0.2) DNA methylation levels (1k-cell stage). P-values were calculated by χ2 test. (B) The table shows the list of transcription factor DNA-binding motifs with the highest enrichment score, which is calculated by GSEA, and the enrichment score is associated with the enrichment of motifs at the high DNA methylation state. RNA levels of the transcription factors before and during ZGA are shown. RNA levels higher than 100 FPKM, between 1 and 100 FPKM, and less than 1 FPKM are indicated in red, blue, and orange, respectively. (C) The box plot shows the decrease in the ATAC-seq signals at the Pou5f3 binding sites (at distal regions with high DNA methylation levels) upon knockdown of pou5f3 and the partial recovery of the signals after co-injections with MO and the pou5f3 mRNA. P-values were calculated by Wilcoxon test. (D) The box plot shows the decrease in the ATAC-seq signals at the Nanog binding sites (at distal regions with high DNA methylation levels) upon knockdown of nanog and the partial recovery of the signals after co-injections with MO and the nanog mRNA. P-values were calculated by Wilcoxon test. (E) The genome browser view shows the ATAC-seq signals at the representative region as an example of decreasing accessibility at highly methylated distal regions upon knockdown of pou5f3 and the partial recovery after co-injections with MO and the pou5f3 mRNA. DNA methylation levels at sperm, oocyte, 1k-cell stage, and 24 hpf stage are also shown. (F) The heat map shows the relationship between the locations of the ATAC-seq peak (oblong stage), DNA methylation level (sperm, oocyte, 1k-cell stage, 24 hpf, and 24 hpf upon knockdown of tet) and ChIP-seq signals for Pou5f3 (5 hpf) and Nanog (high stage; 3.5 hpf) within ±1 kb that is centered on the distal accessible chromatin with a high DNA methylation level (1k-cell stage). Regions are ranked according to the DNA methylation level at 24 hpf. The yellow dotted line divides the regions into the upper group with maintained high DNA methylation levels at 24 hpf and the lower group with DNA demethylation at 24 hpf.


