
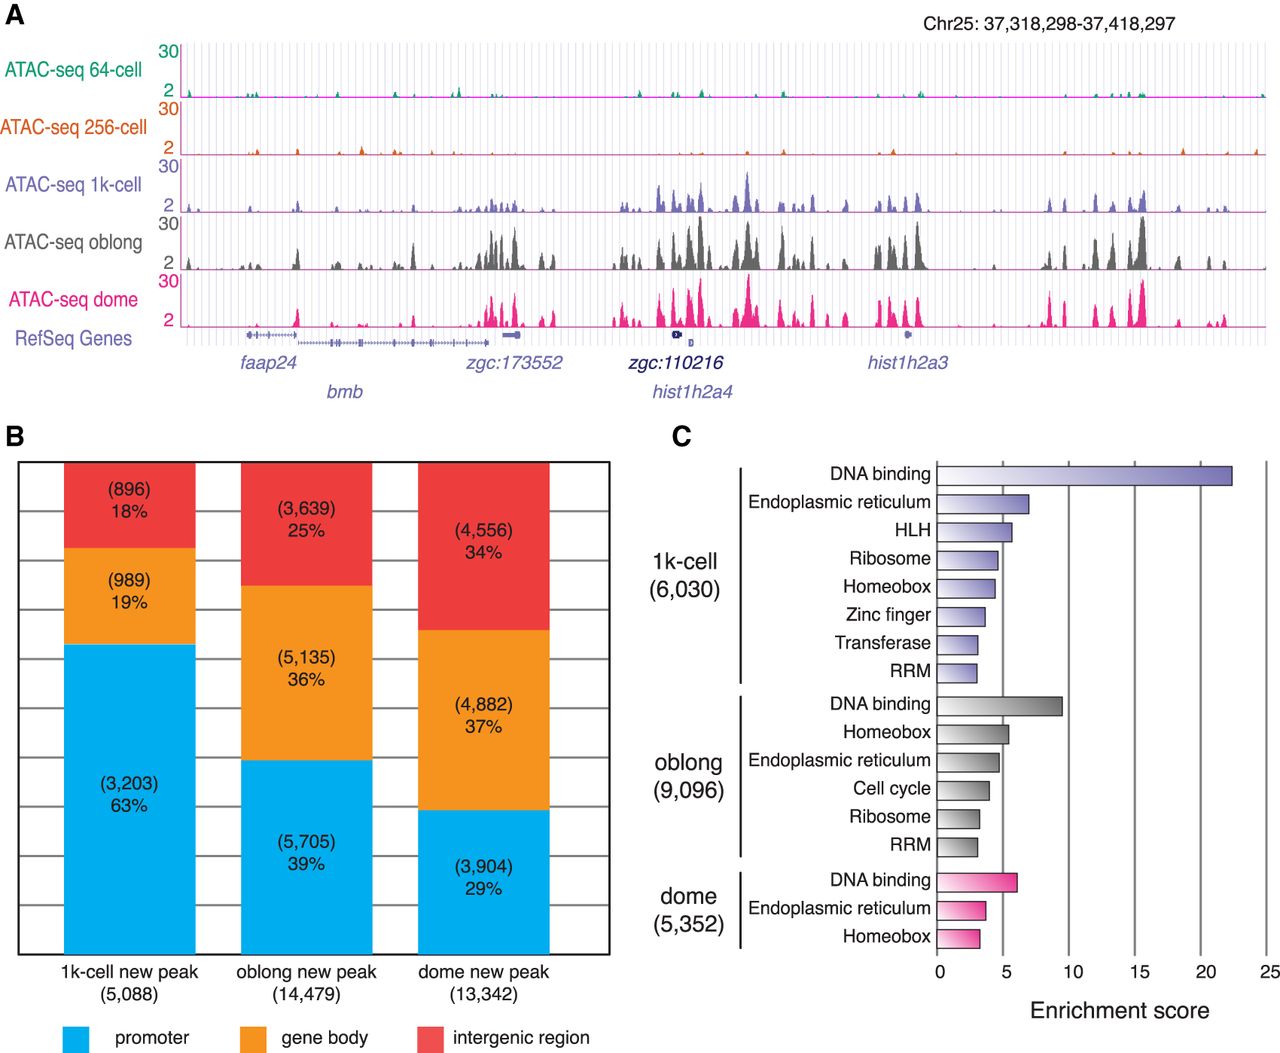
Figure 2.
Establishment of accessible chromatin during the major phase of ZGA. (A) The genome browser view shows the ATAC-seq signals at the representative region as an example of accessible chromatin that appeared during the major phase of ZGA. (B) The bar plot shows the percentages of newly established ATAC-seq peaks that are in the promoter (TSS ± 2 kb), gene body, and intergenic region during the major phase of ZGA. (C) GO enrichment analysis of genes with newly accessible promoters at the major phase of ZGA. Enrichment scores were calculated by DAVID (Huang da et al. 2009a,b).


