
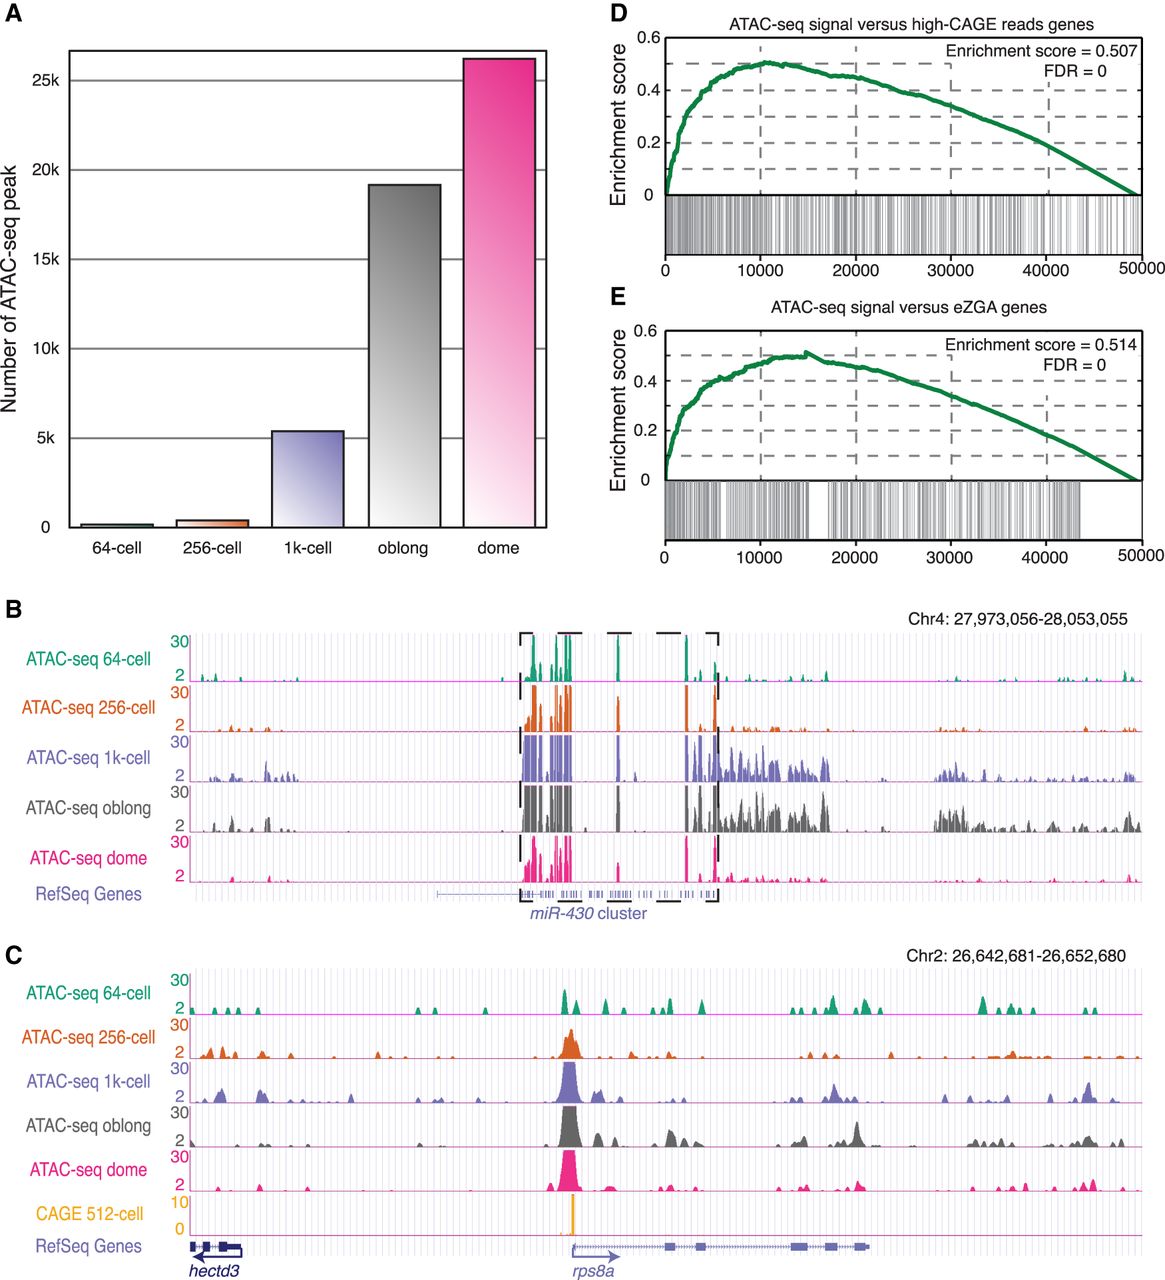
Establishment of accessible chromatin during the minor phase of ZGA. (A) The bar plot illustrates the number of accessible chromatin regions at each stage during ZGA. (B) The genome browser view shows the ATAC-seq signals around the miR-430 cluster regions, which are indicated by the dashed box. (C) The genome browser view highlights the ATAC-seq signals at the rps8a locus as a representative example of accessible chromatin that appeared at the 256-cell stage. (D) Gene Set Enrichment Analysis (GSEA) for the association between promoter accessibility and transcription activity. All genes were ranked according to the levels of chromatin accessibility at the promoters at the 256-cell stage. Genes with more than 500 CAGE reads around their TSSs at the 512-cell stage (TSS ± 50 bp; 811 genes) were treated as a gene set. Enrichment score and FDR were calculated by GSEA. (E) GSEA for the association between promoter accessibility and transcription activity. All genes were ranked according to the levels of chromatin accessibility at the promoters at the 256-cell stage. The reported early ZGA genes (993 genes) were treated as a gene set. Enrichment score and FDR were calculated by GSEA.


