
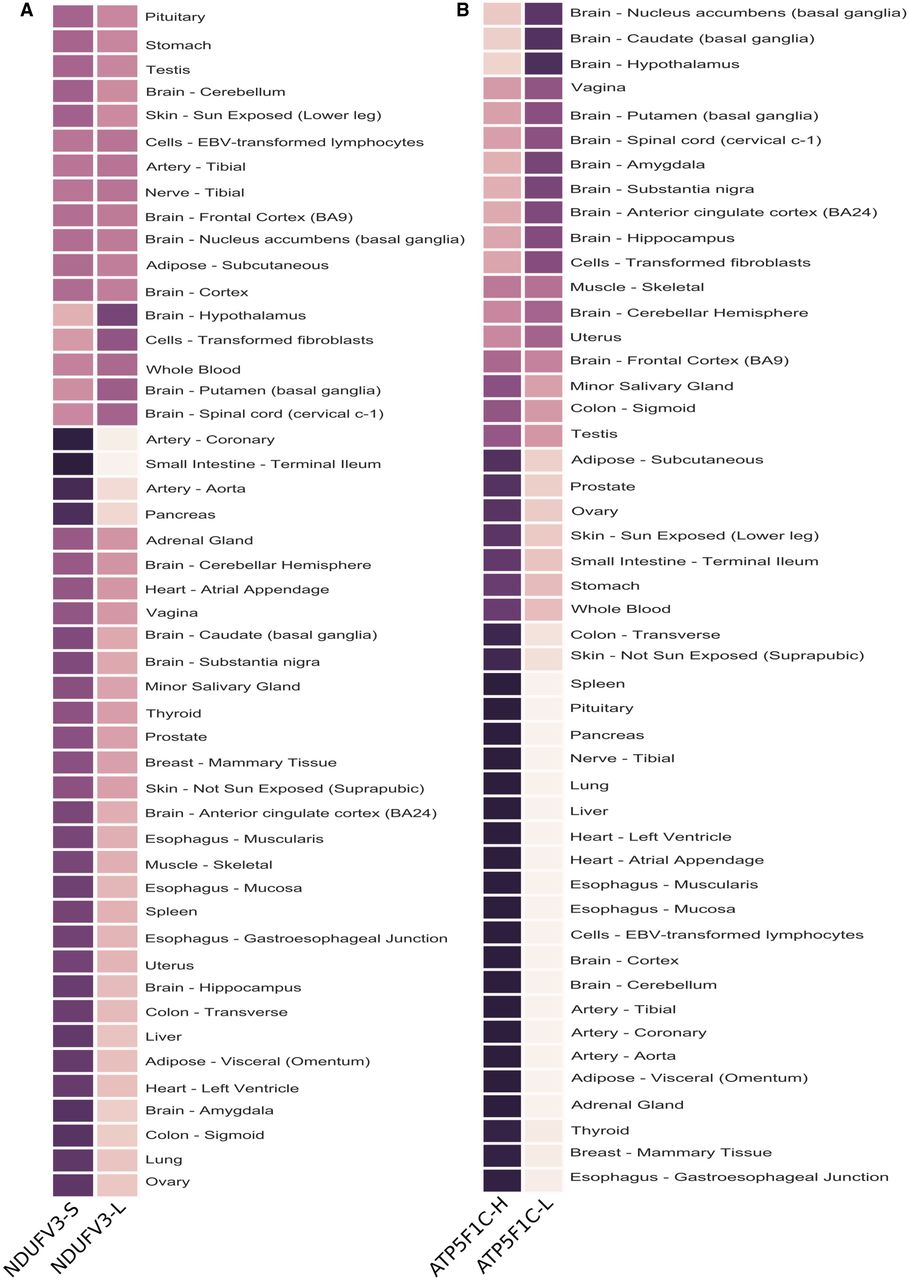
Figure 7.
Tissue-dependent expression correlation of NDUFV3 and ATP5F1C splice-isoforms with the main OXPHOS cluster. (A,B) Heat maps representing relative expression correlations between NDUFV3 (A) and ATP5F1C (B) splice-variants and the “main OXPHOS transcript cluster.”


