
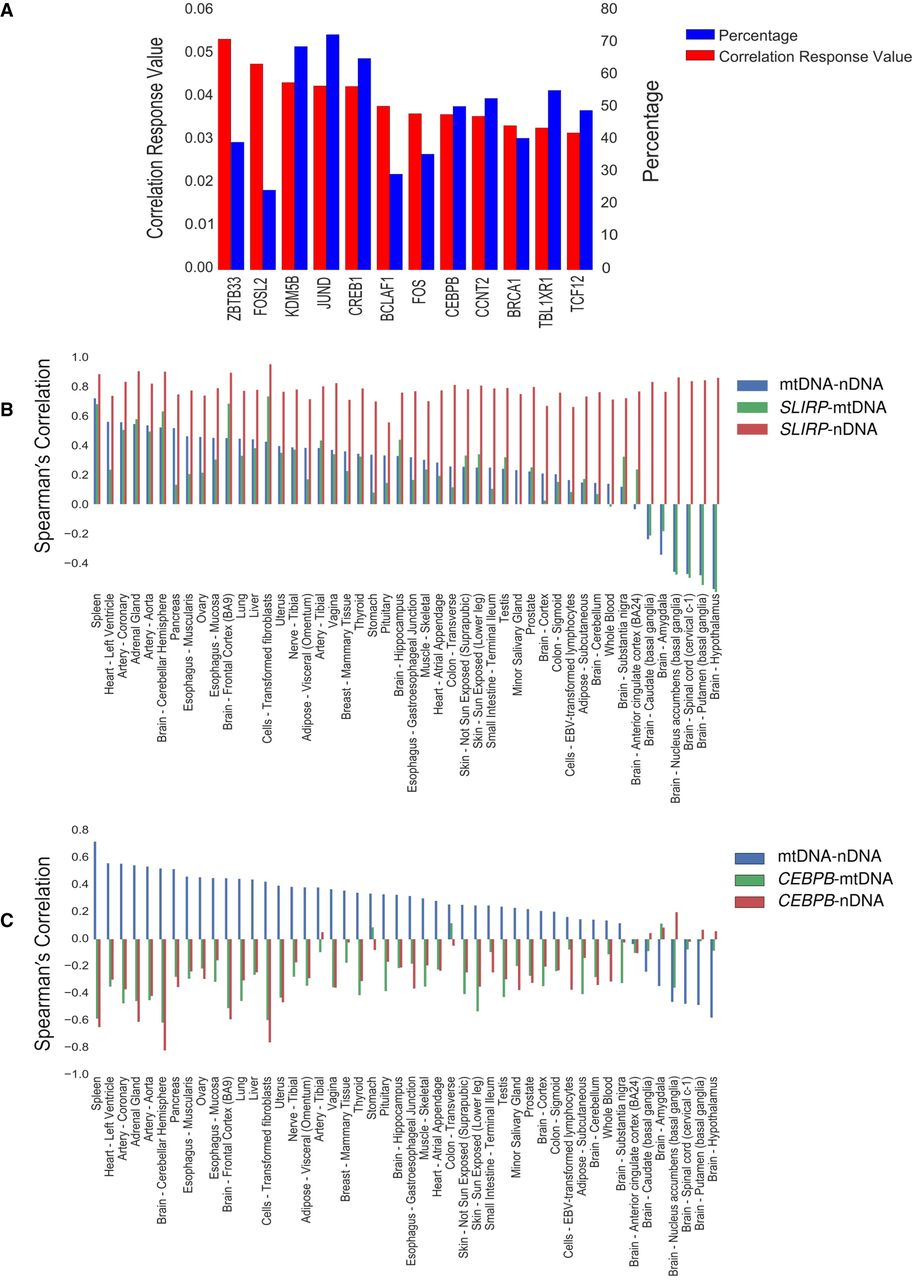
Figure 6.
Candidate factors that best explain mito-nuclear coregulation. (A) Bar plot showing 15 transcription factors that bind cis-regulatory elements of nDNA-encoded OXPHOS genes in vivo and correlate with their co-expression. (B,C) Bar plots of the expression correlations between either the genes encoding mtRNA-binding protein SLIRP (B) or the mtDNA-binding transcription factor CEBPB (C) with the median expression values of mtDNA- (green bars) and nDNA-encoded (red bars) OXPHOS genes. Blue bars represent the median value of correlation between mtDNA- and nDNA-encoded OXPHOS genes.


