
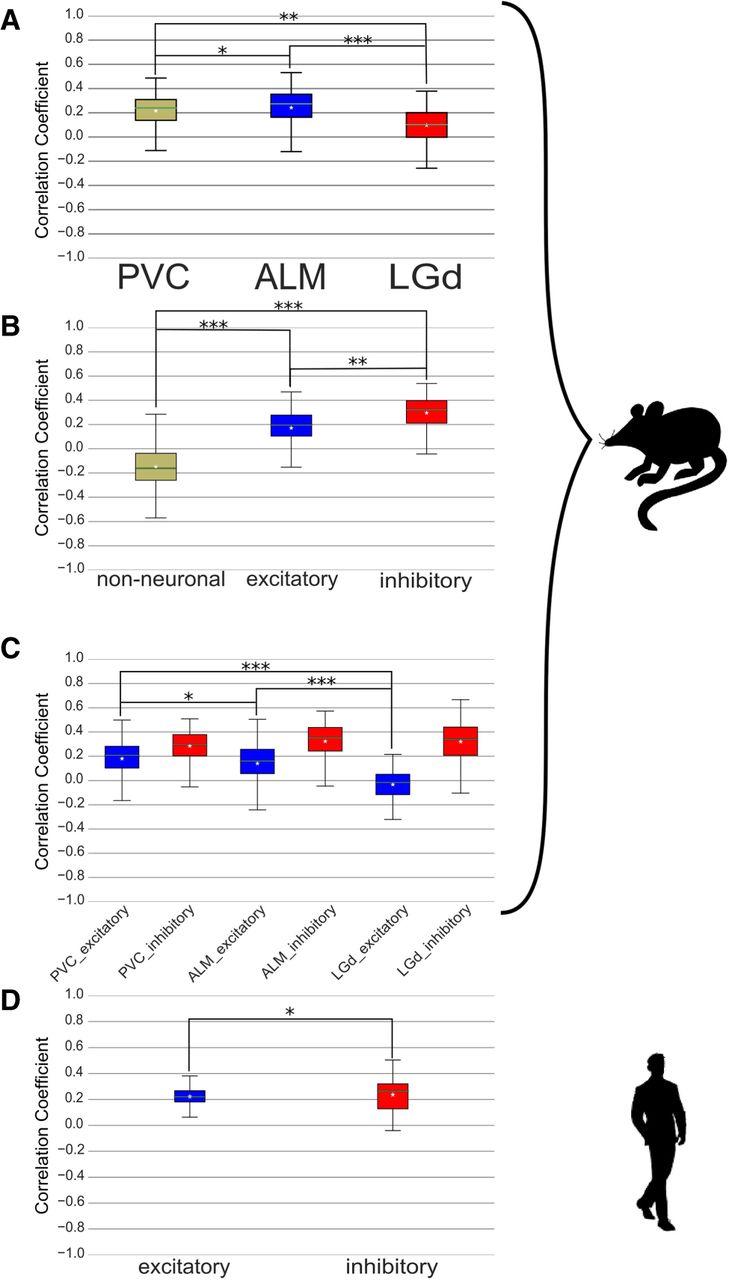
Single-cell RNA-seq analysis indicate spatial and cell-type–dependent effect on OXPHOS mito-nuclear genes co-expression. (A) Box plots showing Spearman's rank OXPHOS mito-nuclear expression correlation values in a bulk of mouse brain cells, grouped according to their brain region collection site. Star: average value (in all subsequent panels). (B) Box plots showing Spearman's rank OXPHOS mito-nuclear expression correlation values in mouse brain cells, bulked according to their assigned cell type. (C) Box plots showing Spearman's rank OXPHOS mito-nuclear expression correlation values in mouse brain neurons, bulked according to brain regions and neuronal type. (D) Box plots showing Spearman's rank OXPHOS mito-nuclear expression correlation values in human brain cells (nuclei), bulked according to their assigned neuronal cell type.


