
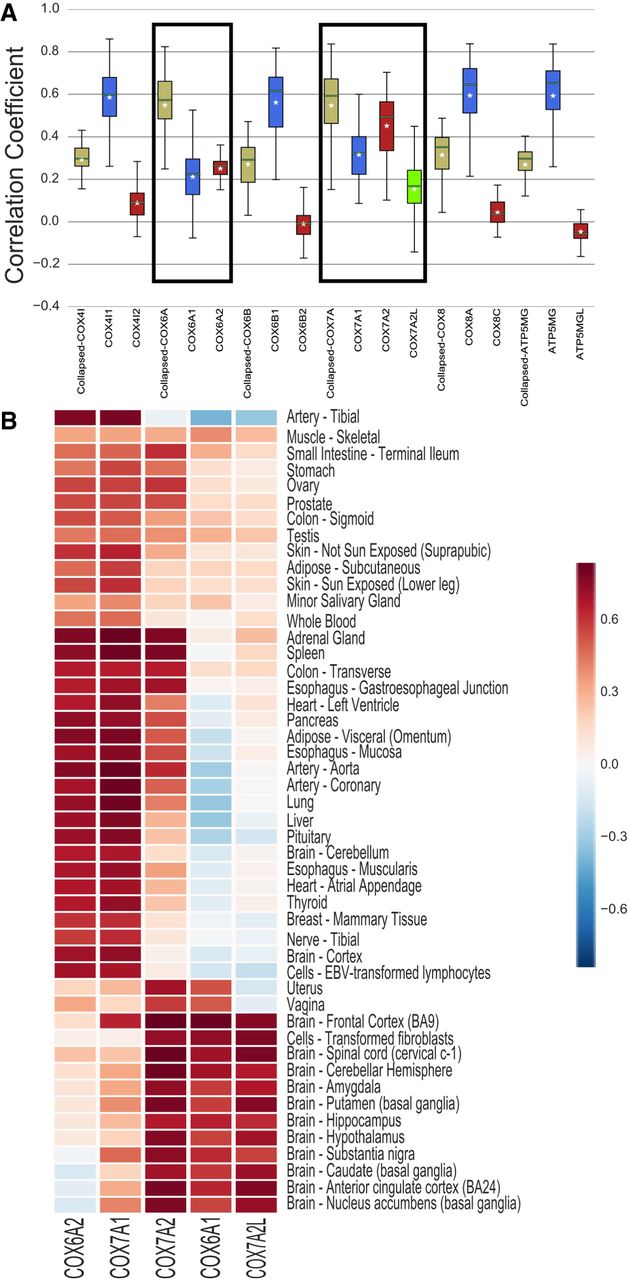
Figure 3.
The various gene paralogs of COX6A and COX7A are co-expressed with OXPHOS genes in various tissues. (A) Box plot demonstrating the distributions of expression correlations of OXPHOS genes with the grouped (collapsed) paralogs per each of the following seven OXPHOS subunits: COX4I, COX6A2, COX6B, COX7A2, COX7B, COX8, and ATP5MG) (greenish gray) and the expression vectors of the indicated gene paralogs (blue, red, and green). (B) A heat map demonstrating OXPHOS genes expression correlation values with COX6A and COX7A paralogs, considering the 48 different tissues tested in the current study.


