
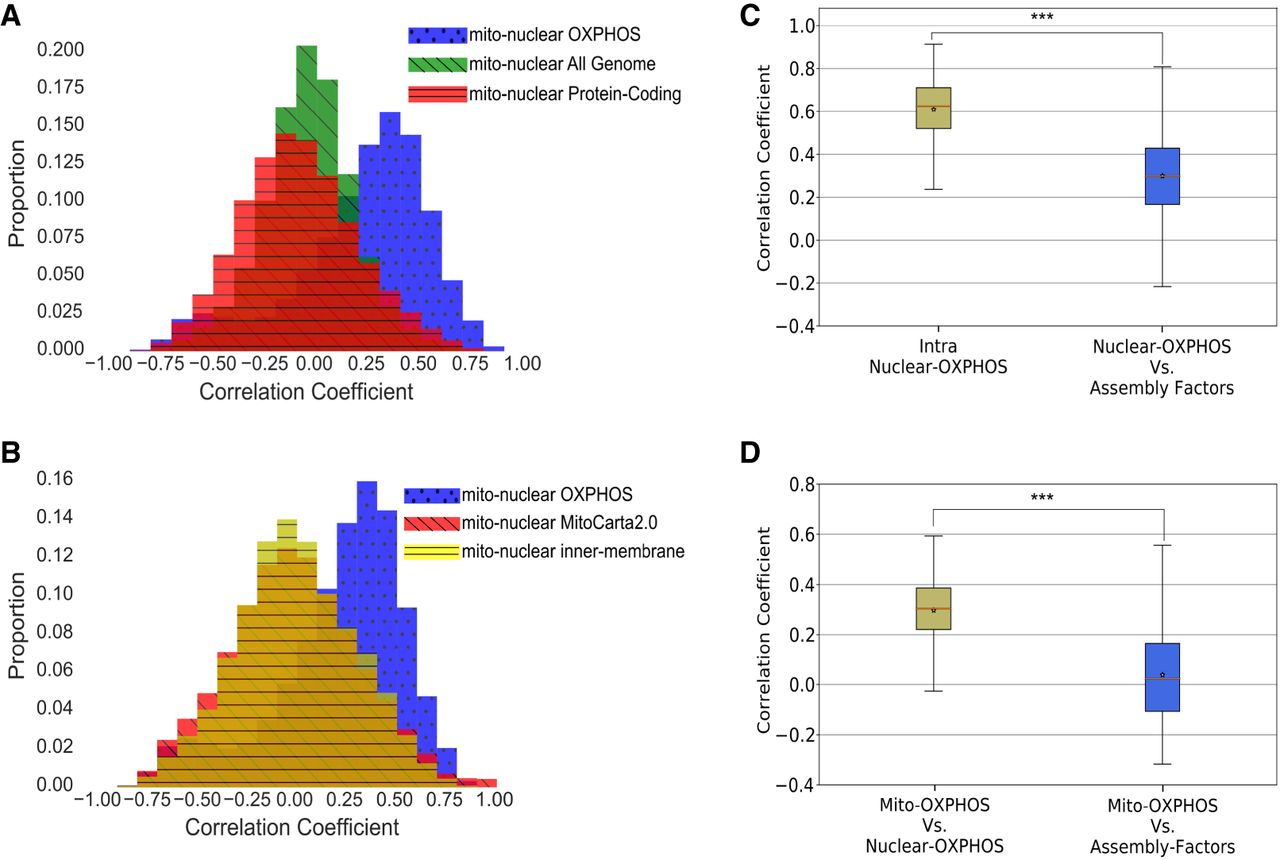
The overall positive co-expression of mitochondrial and nuclear genes is limited to OXPHOS structural subunits, excluding assembly factors. (A) A histogram panel demonstrating expression correlation distributions between mtDNA-encoded OXPHOS genes and either genome-wide non-OXPHOS genes (green), non-OXPHOS protein coding genes (red), or nDNA-encoded OXPHOS genes (blue). (B) A histogram panel demonstrating expression correlation distributions between mtDNA-encoded OXPHOS gene and either nDNA-encoded non-OXPHOS mitochondrial proteins listed in MitoCarta2.0 (Calvo et al. 2016) (red), a MitoCarta subset of mitochondrial inner-membrane proteins (yellow), and nDNA-encoded OXPHOS genes as a reference (blue). (C) Box plots representing the correlations (Spearman's correlation coefficients) between nDNA-encoded OXPHOS genes (intra-OXPHOS) versus their correlations with OXPHOS complexes assembly factors genes. Star: average value. (D) Box plots representing the correlations (Spearman's correlation coefficients) of mtDNA OXPHOS genes with nDNA OXPHOS genes versus their correlations with OXPHOS assembly factors. Red lines: median correlation coefficient; stars: average correlation coefficient. (***) P < 1 × 10−100.


