
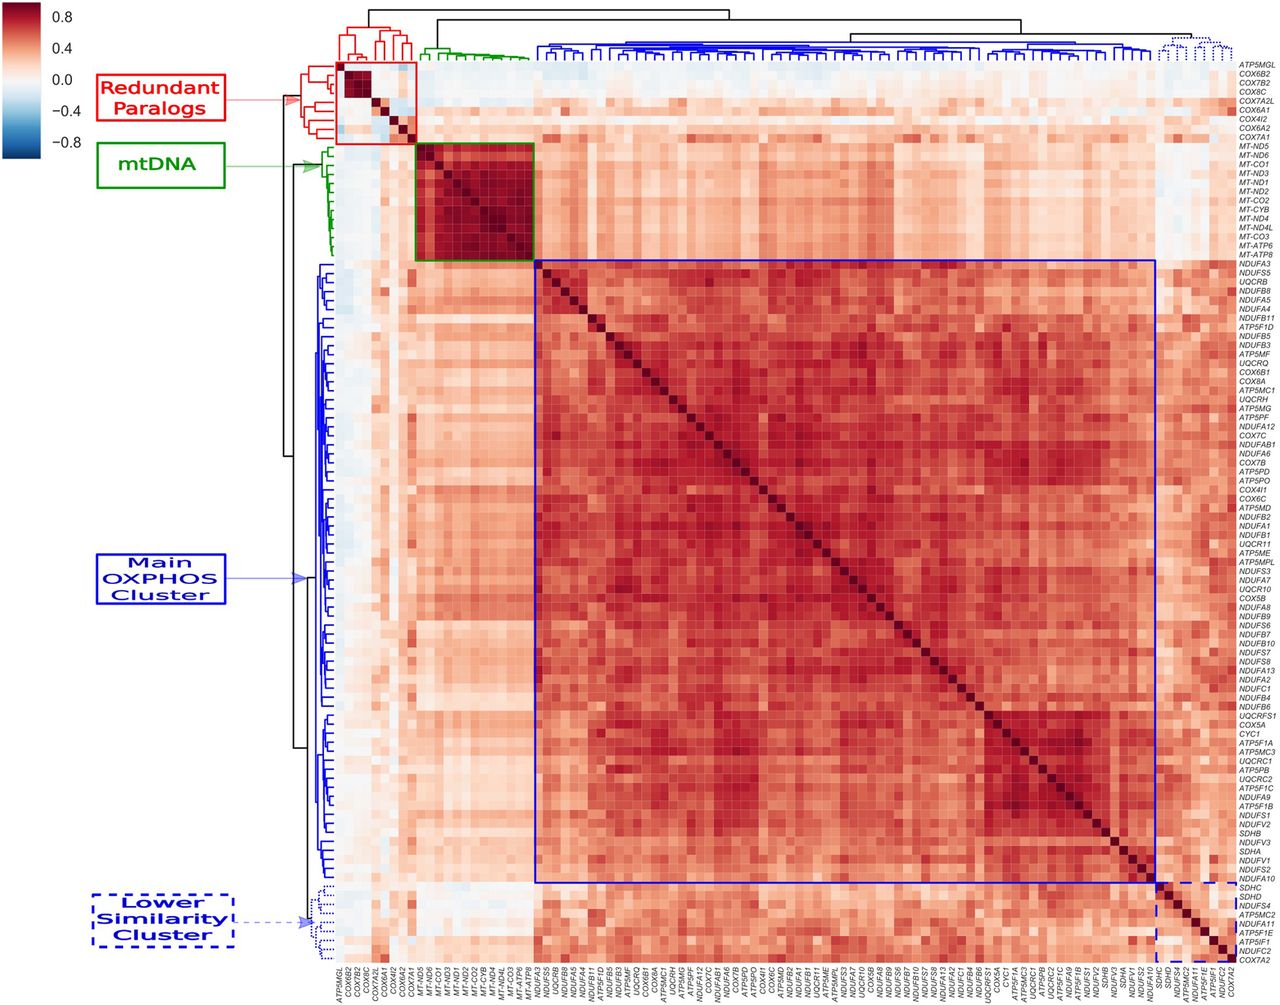
Figure 1.
OXPHOS gene expression patterns across all tissues support the general coregulation of mito-nuclear gene expression. A heat map of correlation values for the expression of all OXPHOS genes. The four clusters (redundant paralogs, mtDNA, main OXPHOS cluster, and lower similarity cluster) are framed in squares (red, green, full blue, and dashed blue line, respectively). A key for the color code of the Spearman's correlation coefficients is shown in top left corner.


