
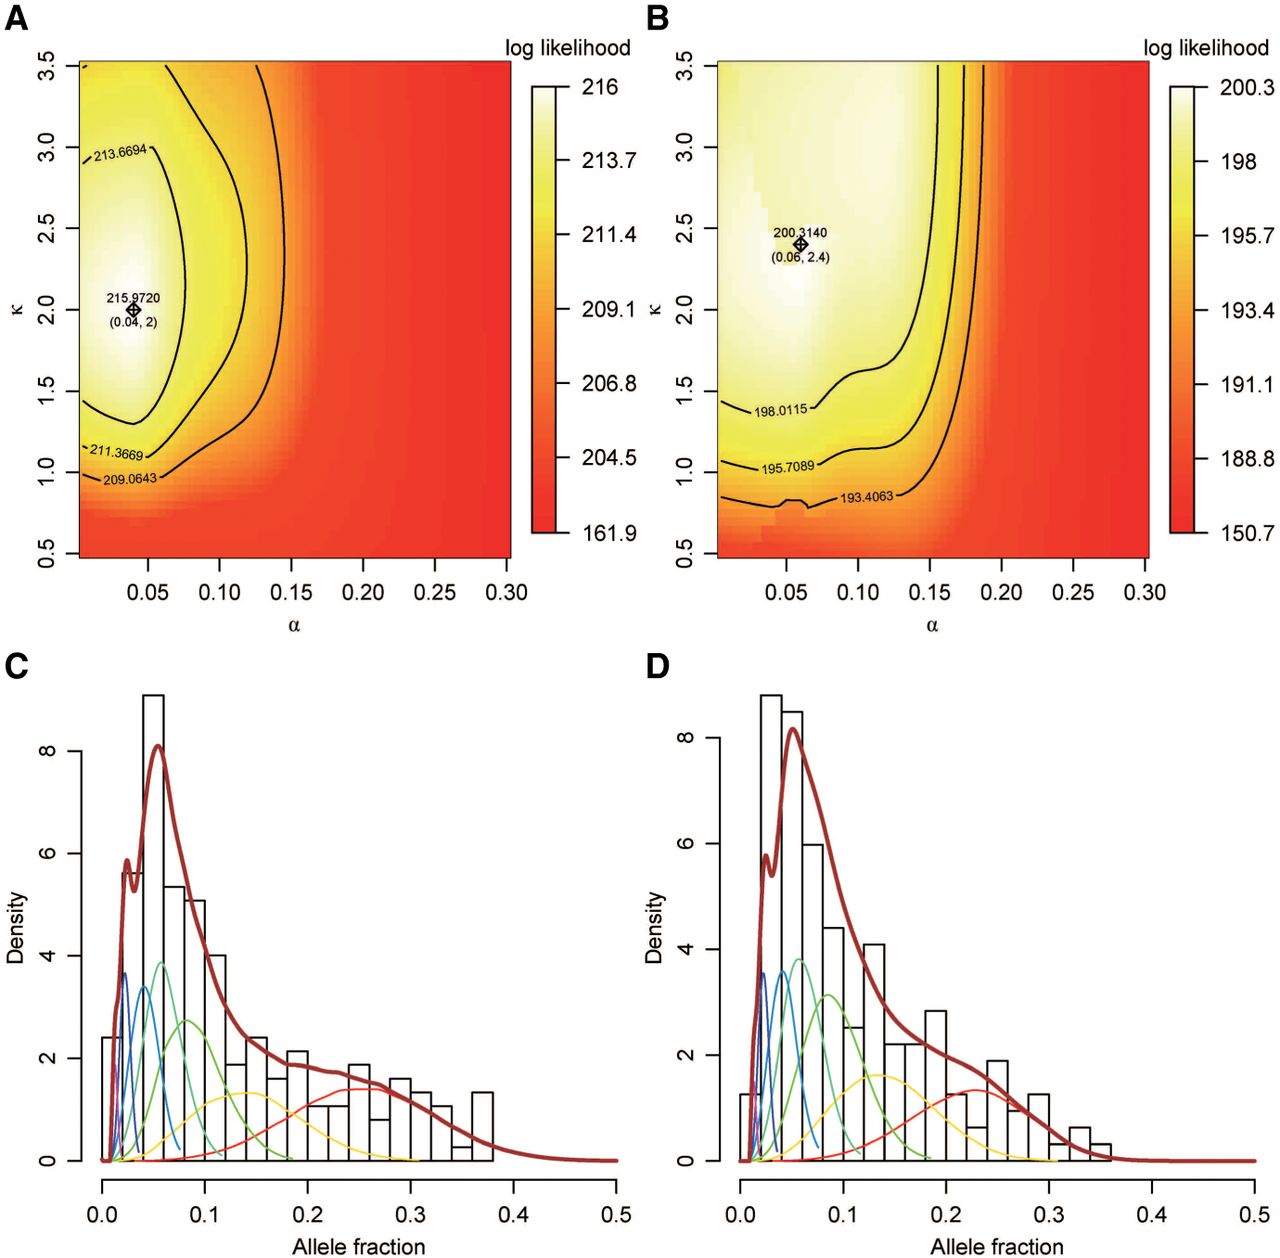
Maximum likelihood estimation (MLE) of cell death rate (α) and relative mutation rate ratio (κ) with the observed AF distribution. (A,B) Contour plots of the likelihood of our model fitted on the (A) WES and (B) WGS data sets. The x-axis denotes the death rate (α), and the y-axis denotes the relative ratio of the mutation rate between first division and latter divisions (κ). The MLEs of α and κ and the corresponding log likelihood are labeled with a cross. The curves from inside to outside show 10%, 1%, and 0.1% likelihood intervals, respectively. Aside from α and κ, the division rate (γ) is free to change, whereas the other parameters “mut steps,” “death from,” “bottleneck at,” bottleneck α, and bottleneck γ are set to 7, 3, 6, 0.5, and 0.5, respectively (Supplemental Table S1; Supplemental Methods). (C,D) Histogram of the AF distributions observed in the (C) WES and (D) WGS data sets. The thick brown curves denote the MLE-fitted, observed AF distribution with α = 0.05, γ = 0.95, and κ = 2.15. The thin inner bell-shape curves with different colors denote the components for different cleavage steps.


