
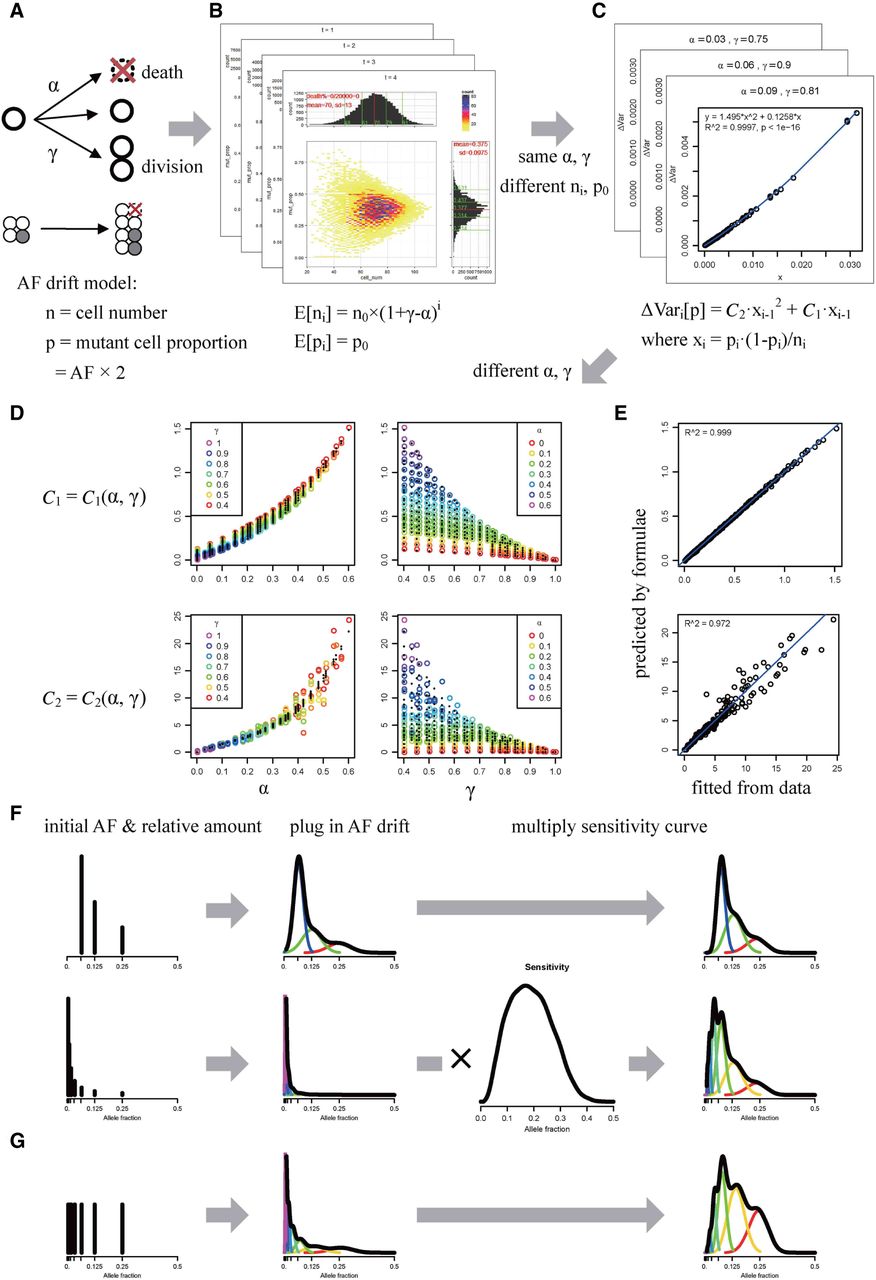
Model describing the accumulation and allele fraction (AF) of postzygotic mosaicisms. (A) The extended Galton-Watson branching process for cell cleavage and AF drift. In each synchronized cleavage step, a cell could die with a probability α or divide with a probability γ. Mutant status (gray) is introduced for mosaicisms, summarized as mutation cell proportion (p) with cell number (n) as parameters. (B) The simulated joint distribution of cell number (ni, x-axis) and mutant cell proportion (pi, y-axis) after the i cleavage steps for each combination of initial parameters (α, γ, n0, and p0). (C) The quadratic regression of the increment of variance of mutant cell proportion ΔVari[p] = Var[pi] − Var[pi−1] = C2 · xi−12 + C1 · xi−1, where xi = pi · (1−pi)/ni, for each combination of α and γ. The blue curve shows the fitted quadratic regression. (D) The regression of the fitted coefficients C1 and C2 on the combination of α and γ. The colored circles are the sample points, and the black dots show the fitted values. Different colors indicate different γ in the plot with α as the x-axis and different α in the plot with γ as the x-axis. (E) The formulas C1(α, γ) and C2(α, γ) predict C1 and C2 well. The blue line is the diagonal line. (F,G) The expected positions of the initial AF and the relative amount for mosaicisms generated in each cleavage step, assuming a constant mutation rate for simple demonstration. (F) Theoretically, the relative ratio for naturally occurring mosaicisms should be proportional to the number of haploid genomes (similar to “exponential growth”). (G) If we consider parental mosaicisms present in one child as de novo mutations, the relative ratio for each cleavage step should stay as 1. The inner bell-shape curves with different colors show the components for different cleavage steps. Parameters were set as α = 0.05 and γ = 0.95, assuming no bottleneck and a constant mutation rate, for demonstration.


