
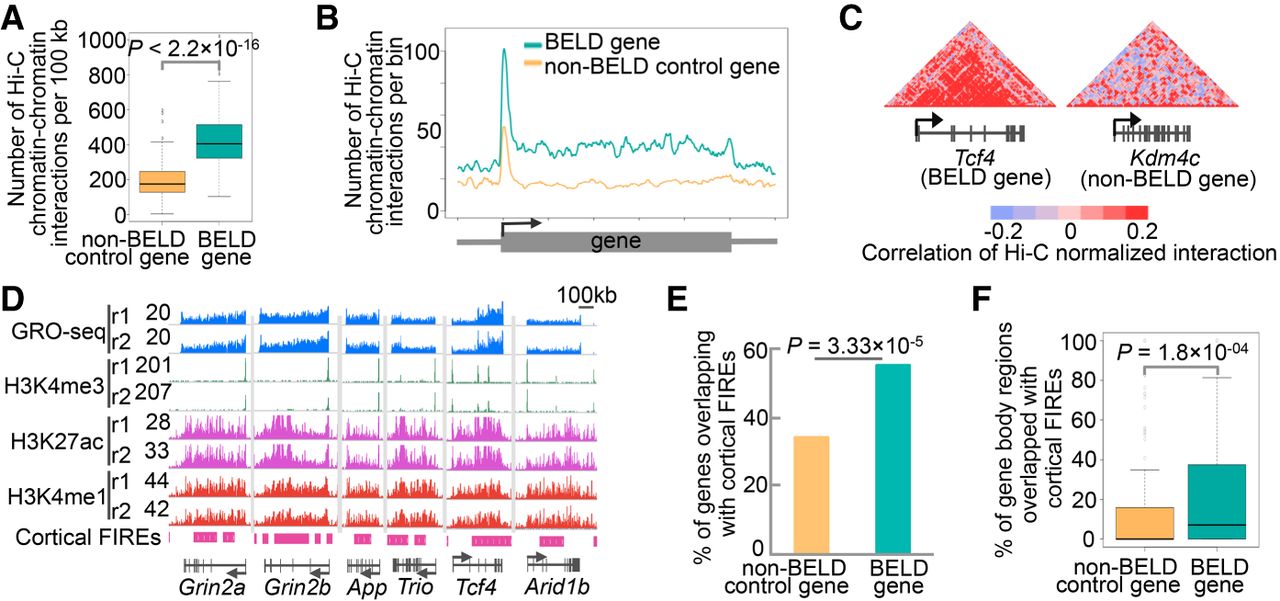
Chromatin–chromatin interactions in BELD genes. (A) Boxplots of Hi-C chromatin–chromatin interactions per 100 kb in non-BELD control genes and BELD genes. P indicates P-value, one-tailed t-test. (B) Comparisons of Hi-C chromatin–chromatin interactions per bin in the cortex between non-BELD control genes and BELD genes in gene body regions and surrounding regions (±100 kb). The values of y-axes are normalized to gene length. (C) Heatmaps of correlations of Hi-C normalized interactions in gene body regions and surrounding regions (±100 kb) of Tcf4 and Kdm4c. (D) Browser representations of GRO-seq, ChIP-seq, and cortical FIREs profiles at six BELD genes linked to ASD. (E) Percentage of genes overlapping with cortical frequently interacting regions (FIREs). P indicates P-value, Fisher's exact test. (F) Boxplot of percentages of gene body regions that overlap with cortical FIREs. P indicates P-value, one-tailed t-test.


