
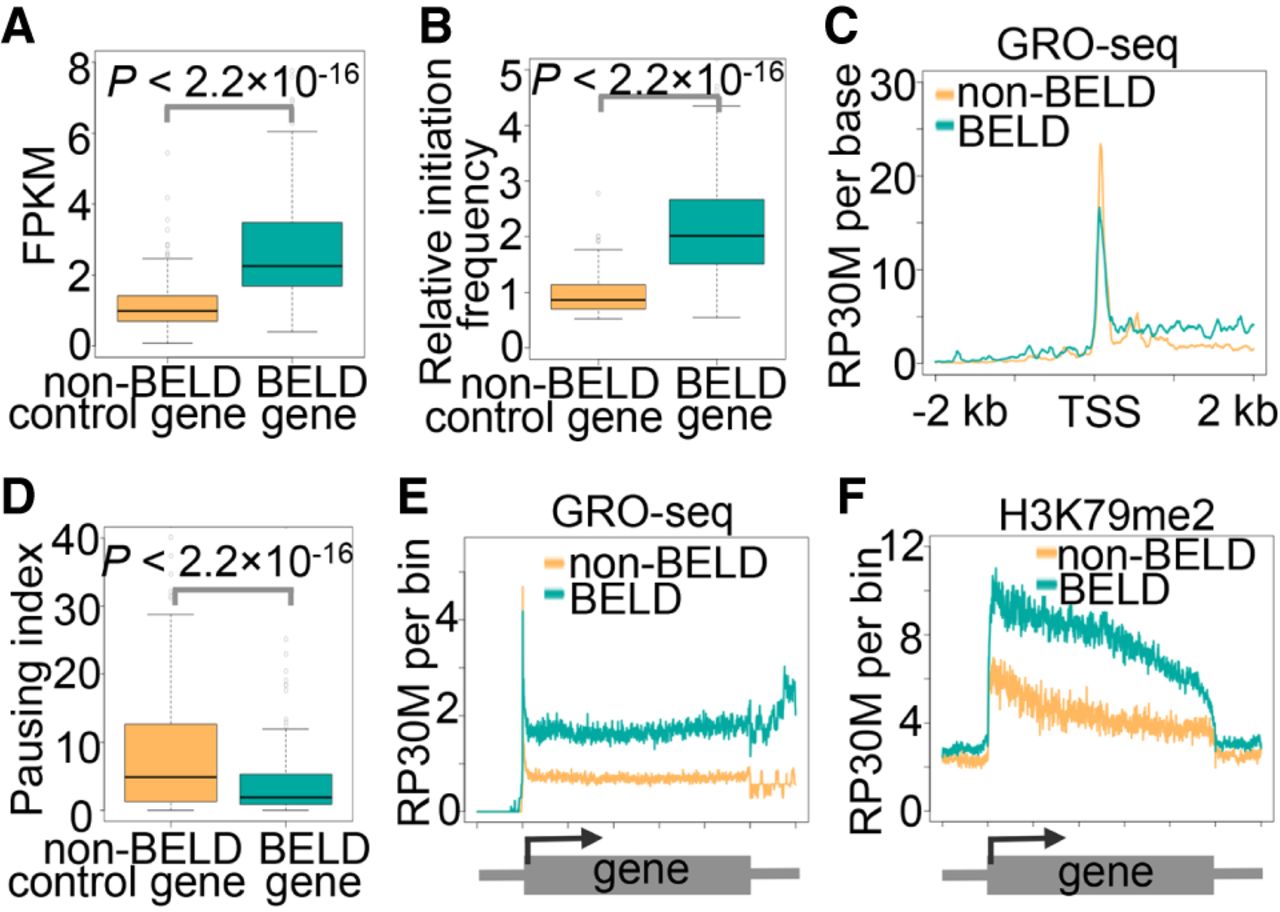
BELD genes display unique transcriptional features. (A) Boxplot representation of the expression levels of BELD and non-BELD control genes. P indicates P-value, one tailed t-test. (B) Boxplot representation of the relative transcription initiation frequency of non-BELD control genes and BELD genes. The ratio of transcriptional initiation frequency was measured by calculating Pol II bindings along the gene bodies from the GRO-seq data. The average initiation frequency of non-BELD control genes was set to one. P indicates P-value, one tailed t-test. (C) Comparison of GRO-seq profile around TSS between non-BELD control genes and BELD genes. (D) Boxplot representation of the pausing index of non-BELD control genes and BELD genes. P indicates P-value, one tailed t-test. (E) Comparisons of GRO-seq profile between non-BELD control genes and BELD genes in gene body regions and surrounding regions (±100 kb). (F) Comparisons of H3K79me2 ChIP-seq profile between non-BELD control genes and BELD genes in gene body regions and surrounding regions (±100 kb).


