
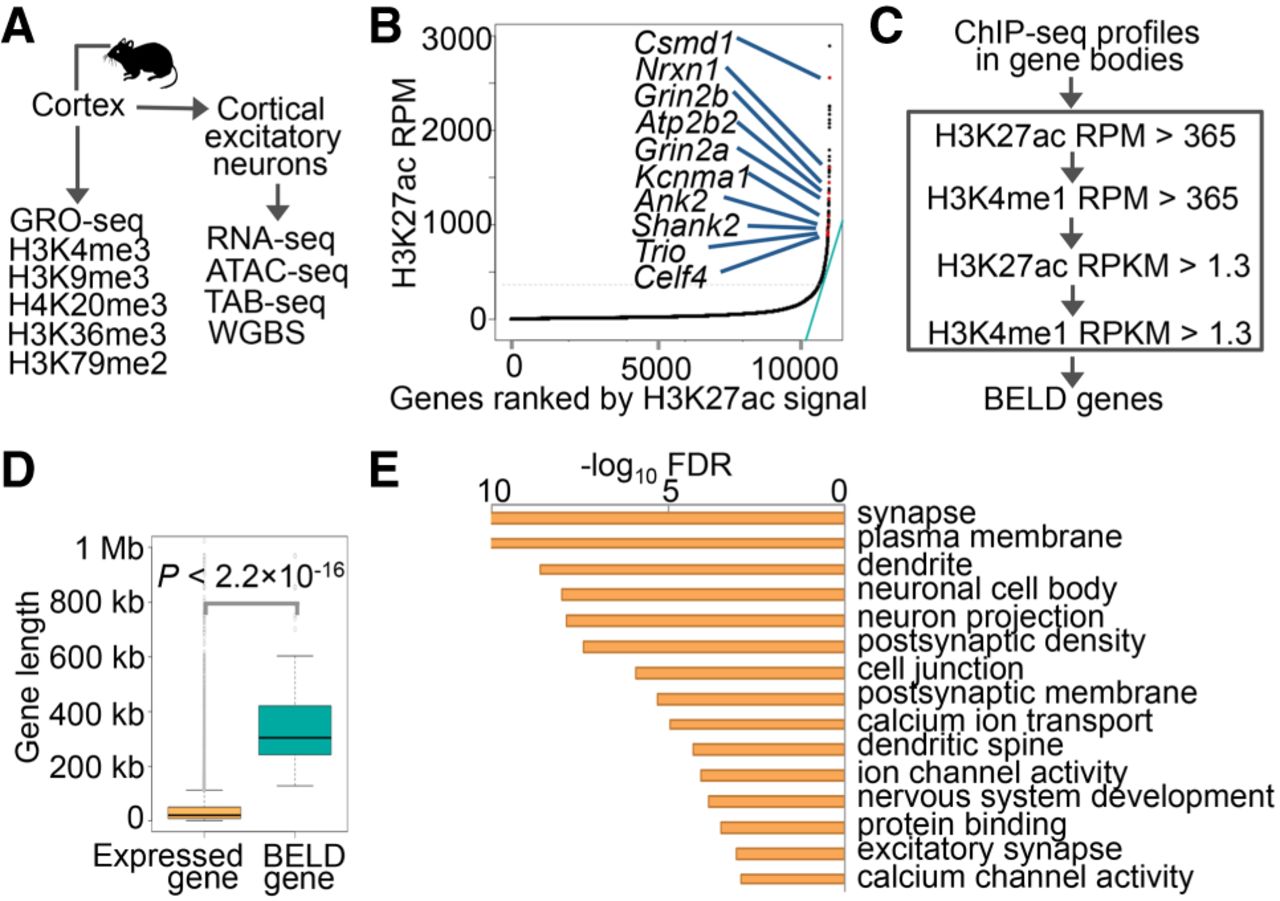
BELD genes in the mouse cortex. (A) Diagram of genomic profiling in this study. The RNA-seq, ATAC-seq, TAB-seq, and WGBS were performed from cortical excitatory neurons, while the GRO-seq and ChIP-seq were performed from the cortex. The cortical excitatory neurons and the cortex were obtained from 6-wk-old male mice. (B) Distribution of gene body H3K27ac signal (RPM) across expressed genes in the cortex. The green line indicates the tangent line with a slope of one. Ten examples of BELD genes with a known role in ASD risk are highlighted. (C) A workflow diagram demonstrating the process used to identify BELD genes. (D) Boxplots of gene lengths of expressed genes and BELD genes in the cortex. P indicates P-value, one-tailed t-test. (E) The top 15 enriched Gene Ontology terms of the BELD genes.


