
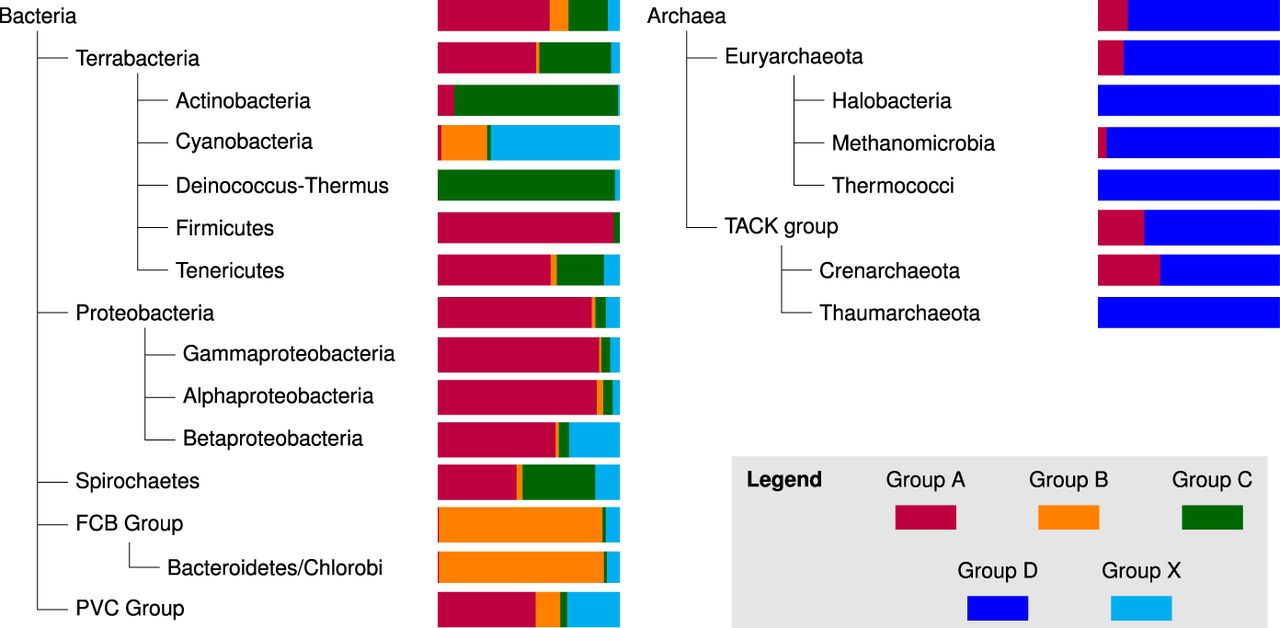
Figure 4.
Color-coded scheme of the distribution of groups A–D and X among ∼5000 representative genomes. The diagram shows the top three levels of the taxonomy trees of both archaea and bacteria.
(Downloading may take up to 30 seconds. If the slide opens in your browser, select File -> Save As to save it.)
Click on image to view larger version.
Color-coded scheme of the distribution of groups A–D and X among ∼5000 representative genomes. The diagram shows the top three levels of the taxonomy trees of both archaea and bacteria.
 CiteULike
 Delicious
 Digg
Digg Facebook
 Google+
 Reddit
 Twitter
