
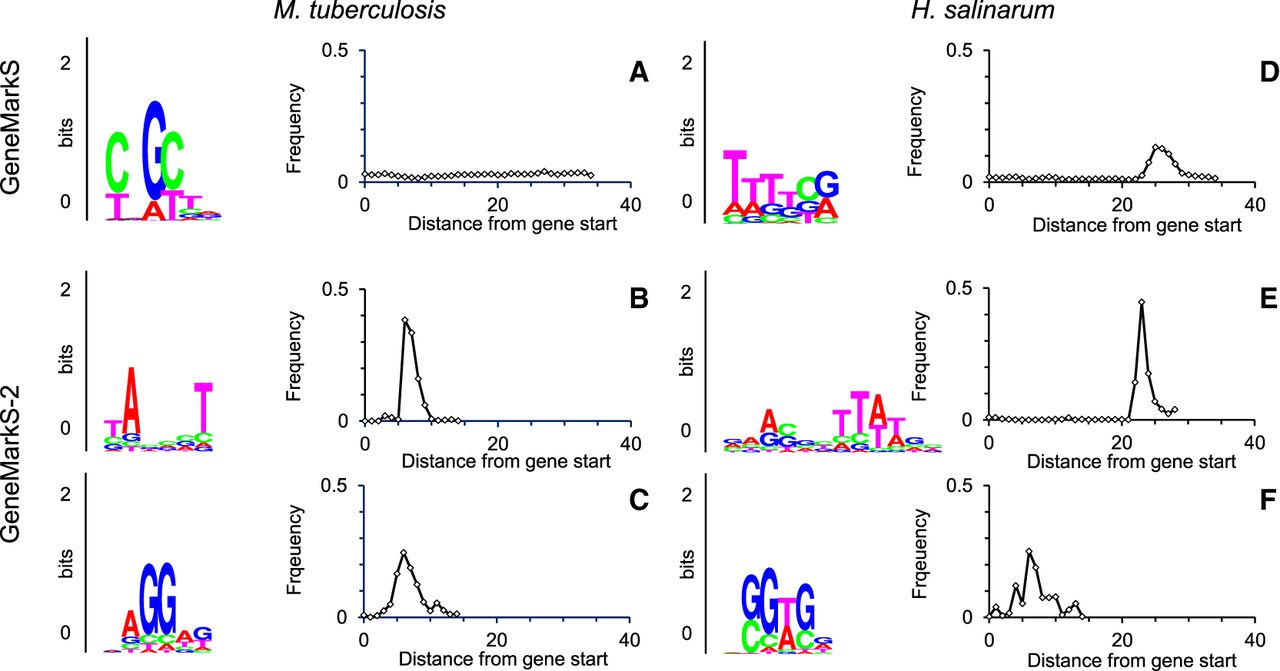
Figure 3.
Motif logos and spacer length distributions for genomes of M. tuberculosis (Group C) and H. salinarum (Group D). In M. tuberculosis, the ‘mixed’ motif found by GeneMarkS has no preferred localization (panel A) in the upstream regions of the first genes in operons. To the contrary, the motif found by GeneMarkS-2 has a clear localization at −10 distance from gene starts, the distance typical for bacterial TATA box and leaderless transcription (B). In upstream regions of internal genes in operons, GeneMarkS-2 built the RBS model and the spacer length distribution (C). For H. salinarum, comparison of GeneMarkS-2 outcomes (E,F) with ones by GeneMarkS (D) shows similar improvements.


