
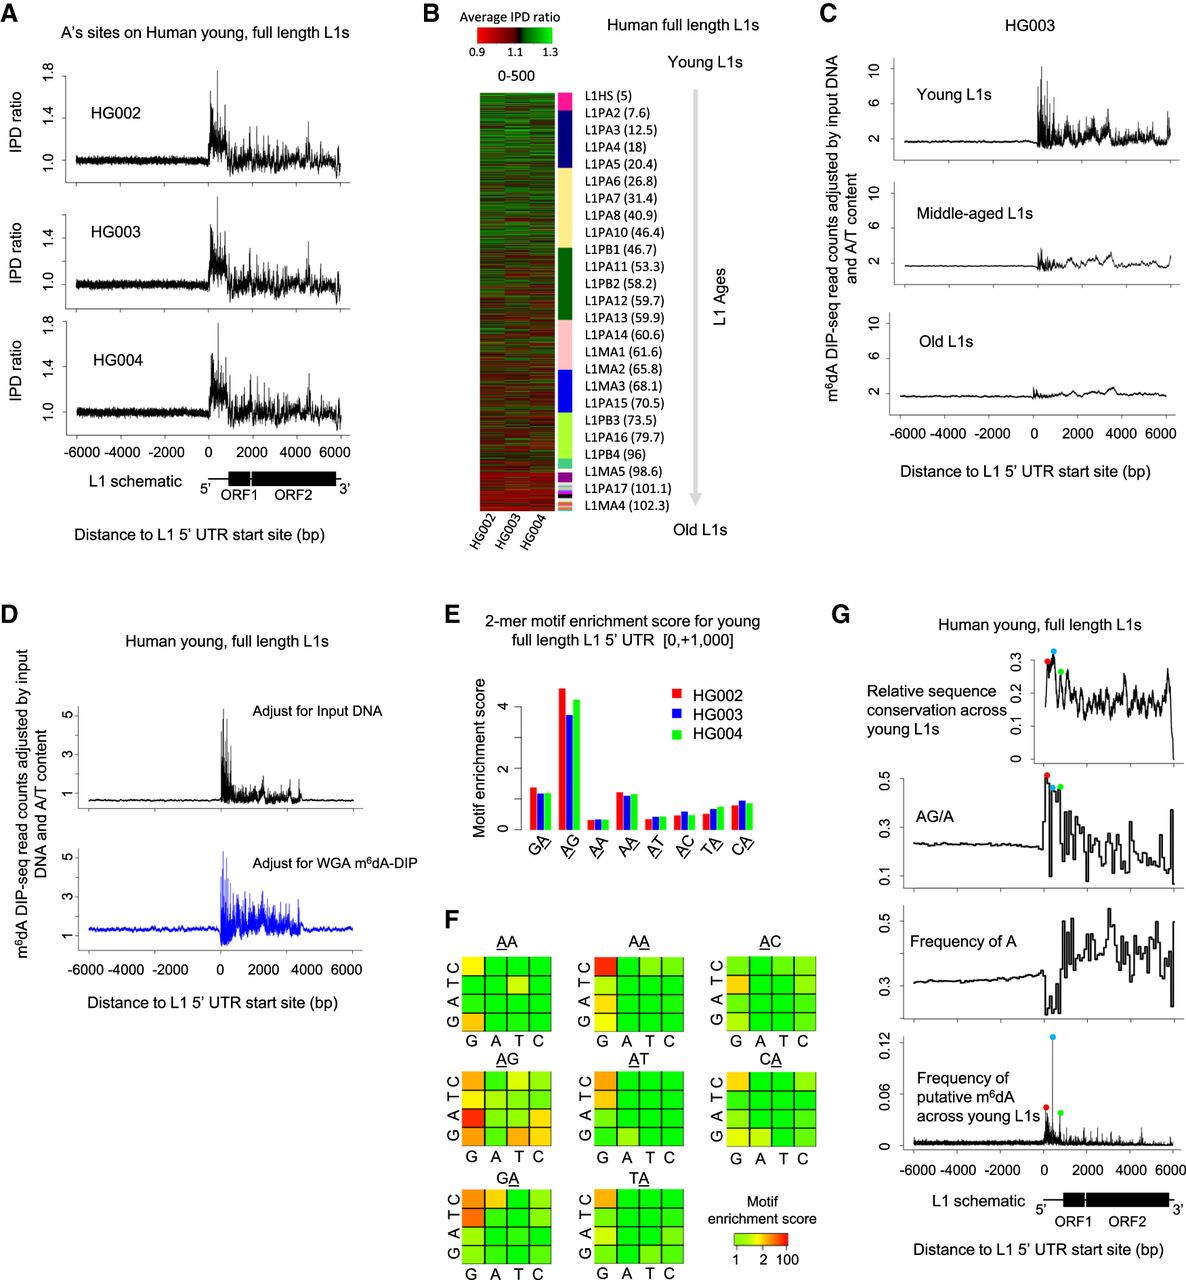
m6dA deposition on full-length L1s in hLCLs. (A) Mean IPD ratio of A sites (adjusted by the frequency of A's) across 1274 young (evolutionary age<10 Myr), full-length (>6000 bp) L1s for three hLCL lines, respectively. Consistent across the trio, the IPD ratio is relatively higher in the promoter and proximal region than the flanking regions. (B) The mean IPD ratio of A sites at full-length L1s is inversely correlated with the L1s’ evolutionary ages in hLCLs. The heatmap shows the mean IPD ratio of A's on each L1, [0, +500] from the 5′ UTR start site, for each of the trio. As indicated in the sidebar, L1s (rows) are ordered by their evolutionary ages. Consistently across the trio, the IPD ratio of A sites is higher in younger full-length L1s than in older L1s. (C) Average m6dA-DIP-seq read count (adjusted for the read count in the input DNA sample and the A/T content) on hLCL young (1274), middle-aged (4164), and old L1 elements (1670), respectively. Consistent with SMRT-seq data, m6dA is enriched at the promoter and proximal region of young full-length L1s. (D) Average m6dA-DIP-seq read count adjusted for the A/T content and the read count in two control samples on hLCL young L1 elements, respectively: input DNA as control (black curve in top panel) and m6dA-DIP-seq on WGA as control (blue curve in bottom panel). (E) Motif AG is enriched for putative m6dA events. The barplot represents the motif enrichment score of all dinucleotide motifs in each of the trio. The putative methylated position is underscored. It suggests that motif AG is enriched for high IPD ratios in clear contrast to all the other dinucleotides. (F) Motif enrichment analysis of human young full-length L1s. Each 4 × 4 heatmap corresponds to all 16 4-mer motifs, for which the second and third bases are fixed at the center/title. The rows and columns in the heatmaps represent the first and last bases of 4-mer motifs. Each cell in the following 4 × 4 heatmaps shows the motif enrichment score based on the native DNA sample. (G) Peaks of putative m6dA events across human young full-length L1s occur at loci with certain sequence features. (Top) Level of sequence conservation across young full-length L1 elements based on multiple alignment by Mauve (Darling et al. 2004); (two middle panels) frequency of AG dinucleotides (relative to A's) and A's on young full-length L1s; and (bottom) frequency of putative m6dA events at each locus across all young full-length L1s (averaged among the trio). The peaks of sequence conservation, AG/A frequency, and m6dA frequency across young full-length L1s are colocalized as indicated by the red, blue, and green dots.


