
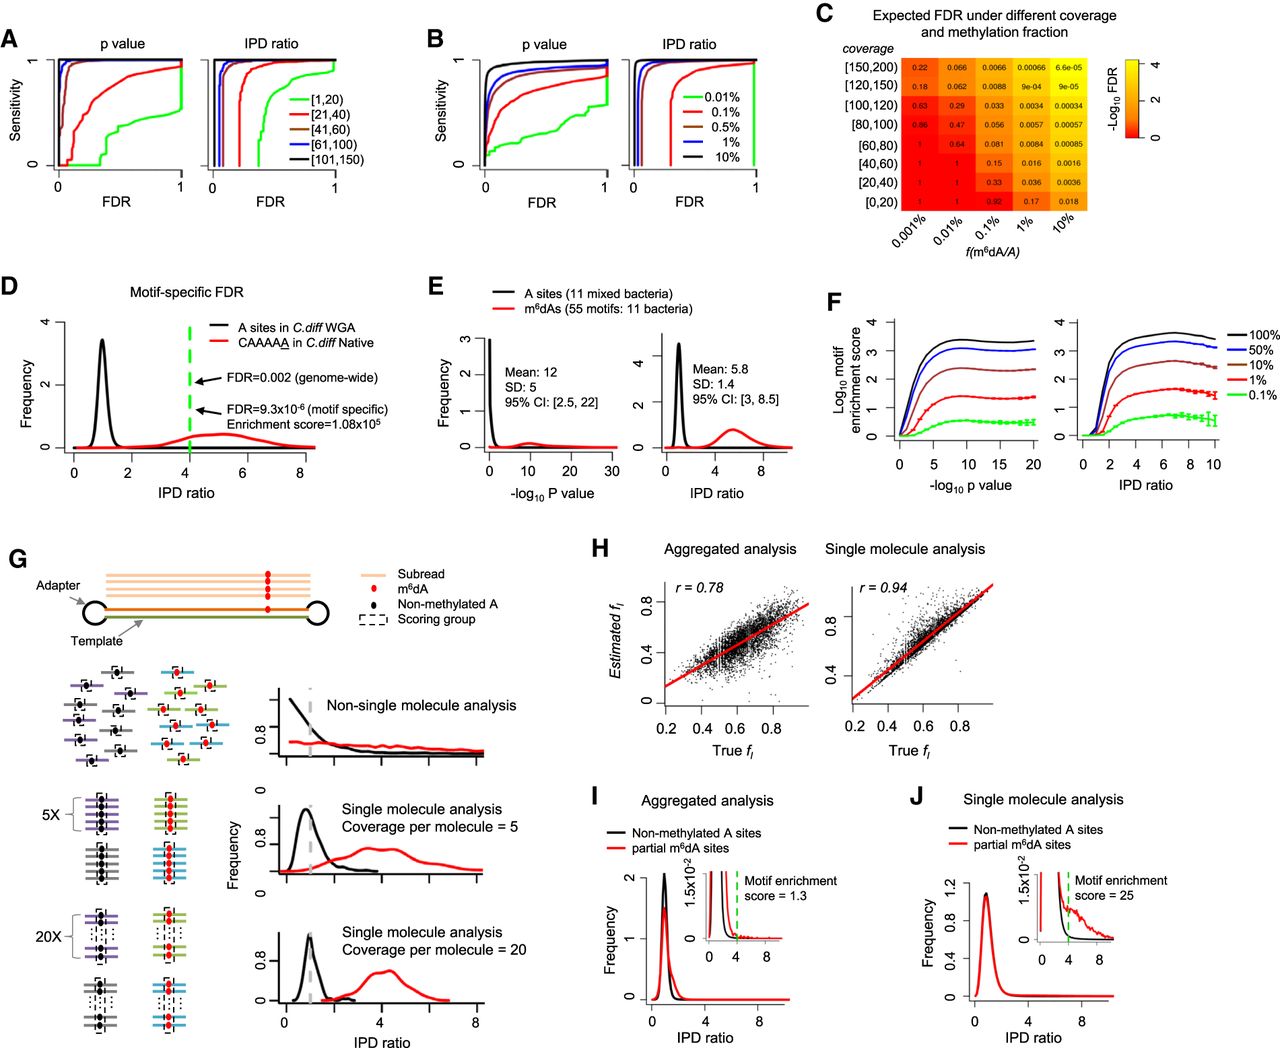
Comprehensive evaluation of m6dA detection based on SMRT-seq data. (A,B) Sensitivity-FDR curves at different levels of per strand SMRT-seq coverage (A) and fraction of methylated A sites in the genome (B). Curves are estimated based on either P-value or IPD ratio; both are shown. FDR estimation is based on the coverage-matched native (Escherichia coli with m6dA at GATC sites; Methods) and WGA samples. (C) FDRs estimated for different combinations of per strand SMRT-seq coverage and fraction of m6dA sites, f(m6dA/A), in the genome. FDR estimation is based on the coverage-matched native and WGA samples (Methods) at an IPD ratio of four. (D) Motif specific methylation detection leads to more reliable m6dA calls with lower FDRs. (E) Distribution of P-values (−log10) and IPD ratios of m6dA events (red) and nonmethylated A's (black) from 11 well-characterized bacterial m6dA methylomes. (F) Enrichment score for motifs with different fractions of motif sites methylated across the genome fm(m6dA/A), estimated based on P-value (−log10; left) and IPD ratio (right). SMRT-seq data from 11 bacterial species/strains with well-characterized m6dA methylomes are used for this simulation analysis. (G) Schematic illustrating single-molecule-level analysis for the estimation of partial methylation. A single molecule (two DNA strands and two adapters) and the subreads that are produced from the top strand of this molecule in SMRT-seq (top). For a given genomic position, when non-single-molecule analysis is performed, IPD ratios for the methylated and nonmethylated subreads follow two exponential distributions (red and black curves in the second panel). In contrast, when single-molecule analysis was performed, IPD ratios across all molecules follow two normal distributions with smaller variance over increasing coverage per molecule strand (third and fourth panels). (H) Estimation of partial methylation fl(m6dA/A) by aggregate analysis (left) and single-molecule-level analysis (right). x-axis indicates background truth fl based on simulation; y-axis, estimated fl; and dots, 4359 A's with known fraction of m6dA methylation based on subsampling from a well-characterized E. coli m6dA methylome. (I,J) Distribution of IPD ratios for partially methylated m6dA sites and nonmethylated A's based on aggregate analysis (I) and single-molecule level analysis (J). The inset provides an enlarged view. The motif enrichment score for the same, known methylation motif GATC significantly differs between the two types of analyses (1.3 in aggregated analysis vs. 25 in single-molecule analysis).


