
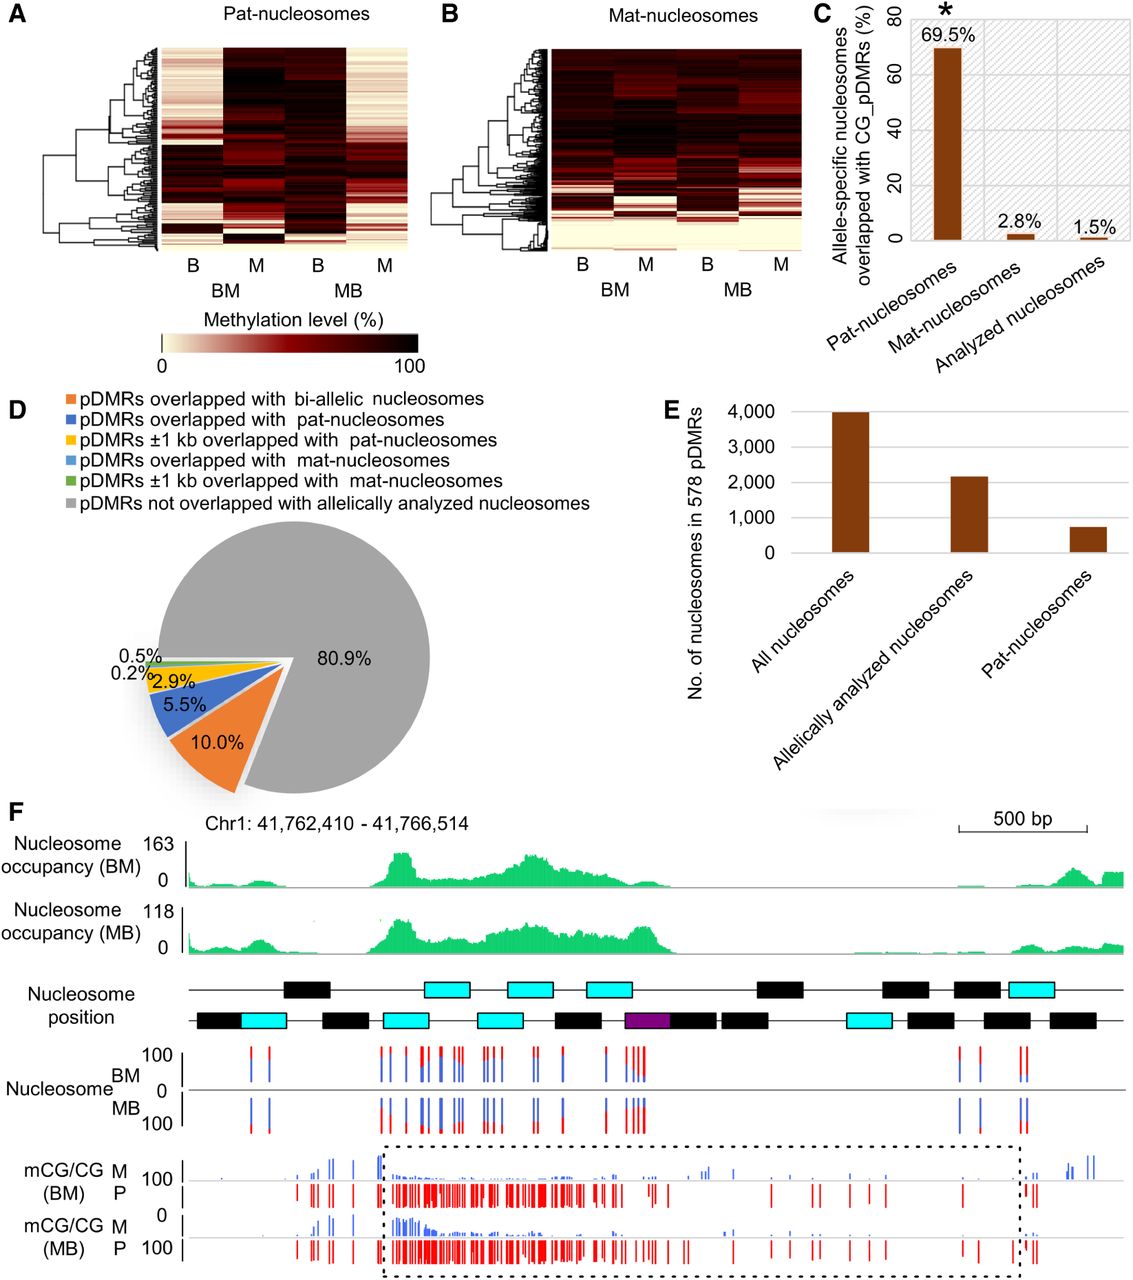
Relationship between DNA methylation and parent-of-origin-dependent nucleosomes. (A,B) Heatmaps of CG methylation levels between alleles of B73 and Mo17 reciprocal crosses at paternal specifically positioned nucleosomes (pat-nucleosomes) and maternal specifically positioned nucleosomes (mat-nucleosomes): (B) B73 allele; (M) Mo17 allele; (BM) B73 × Mo17; (MB) Mo17 × B73. (C) Association of paternal specifically positioned nucleosomes (pat-nucleosomes) and maternal specifically positioned nucleosomes (mat-nucleosomes) with CG_pDMRs. The proportions of pat-nucleosomes, mat-nucleosomes, and all allelically analyzed nucleosomes overlapped with CG_pDMRs are shown on the y-axis. (*) Significant association of pat-nucleosomes with CG_pDMRs (Fisher's exact test; P-value <2.2 × 10⁻¹⁶) compared with that of mat-nucleosomes. (D) The proportion of 6910 CG_pDMRs overlapped with parent-of-origin-dependent nucleosomes. (E) The allelic status of all nucleosomes in 578 CG_pDMRs overlapped with pat-nucleosomes. (F) The integrated view of nucleosome occupancy in one CG_pDMR. The normalized nucleosome levels of endosperm (BM) are plotted in green. The black, blue, and purple rectangles indicate the position of endosperm nucleosomes, allelically analyzed nucleosomes, and high-stringency allele-specific nucleosomes. The percentages of allelic reads of MNase-seq data for specific SNP sites are shown, with red lines for the paternal allele and blue lines for the maternal allele. The DNA methylation level for specific SNP sites are shown for both maternal and paternal alleles, with red lines for the paternal allele (P) and blue lines for the maternal allele (M). The dotted rectangle highlights the pDMRs identified in this region.


