
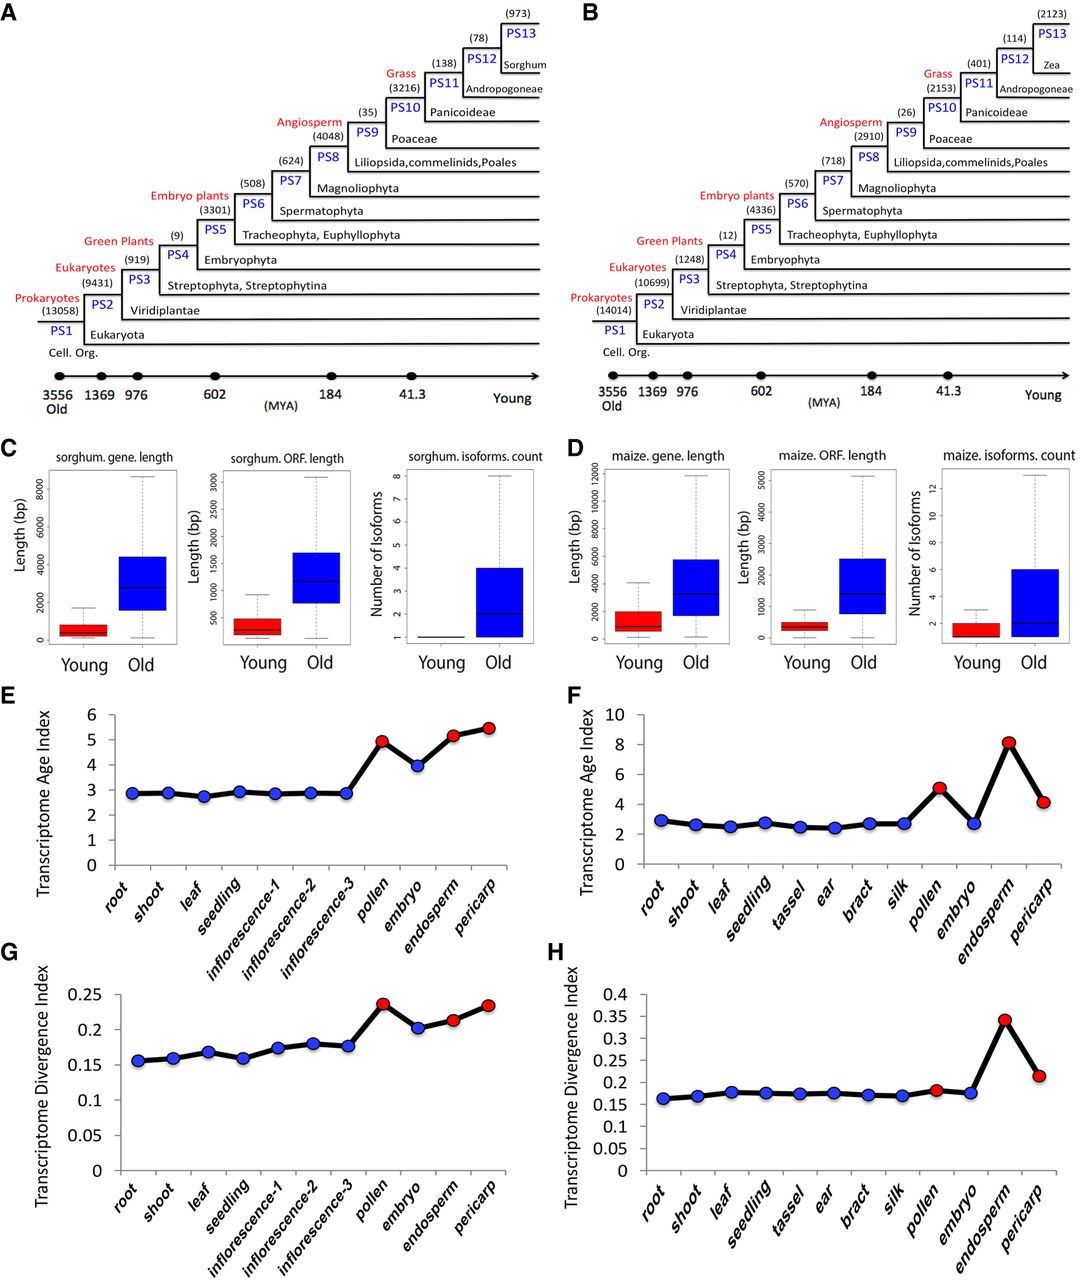
Figure 7.
Phylogratigraphic profile of genes in maize and sorghum and comparison of features between young and old genes. Phylostratigraphic profile of genes in sorghum (A) and maize (B). Comparison of gene/ORF length and number of isoforms between old and young genes in sorghum (C) and maize (D). (E,F) TAI of each tissue in sorghum (E) and maize (F). (G,H) TDI of each tissue in sorghum (G) and maize (H).


