
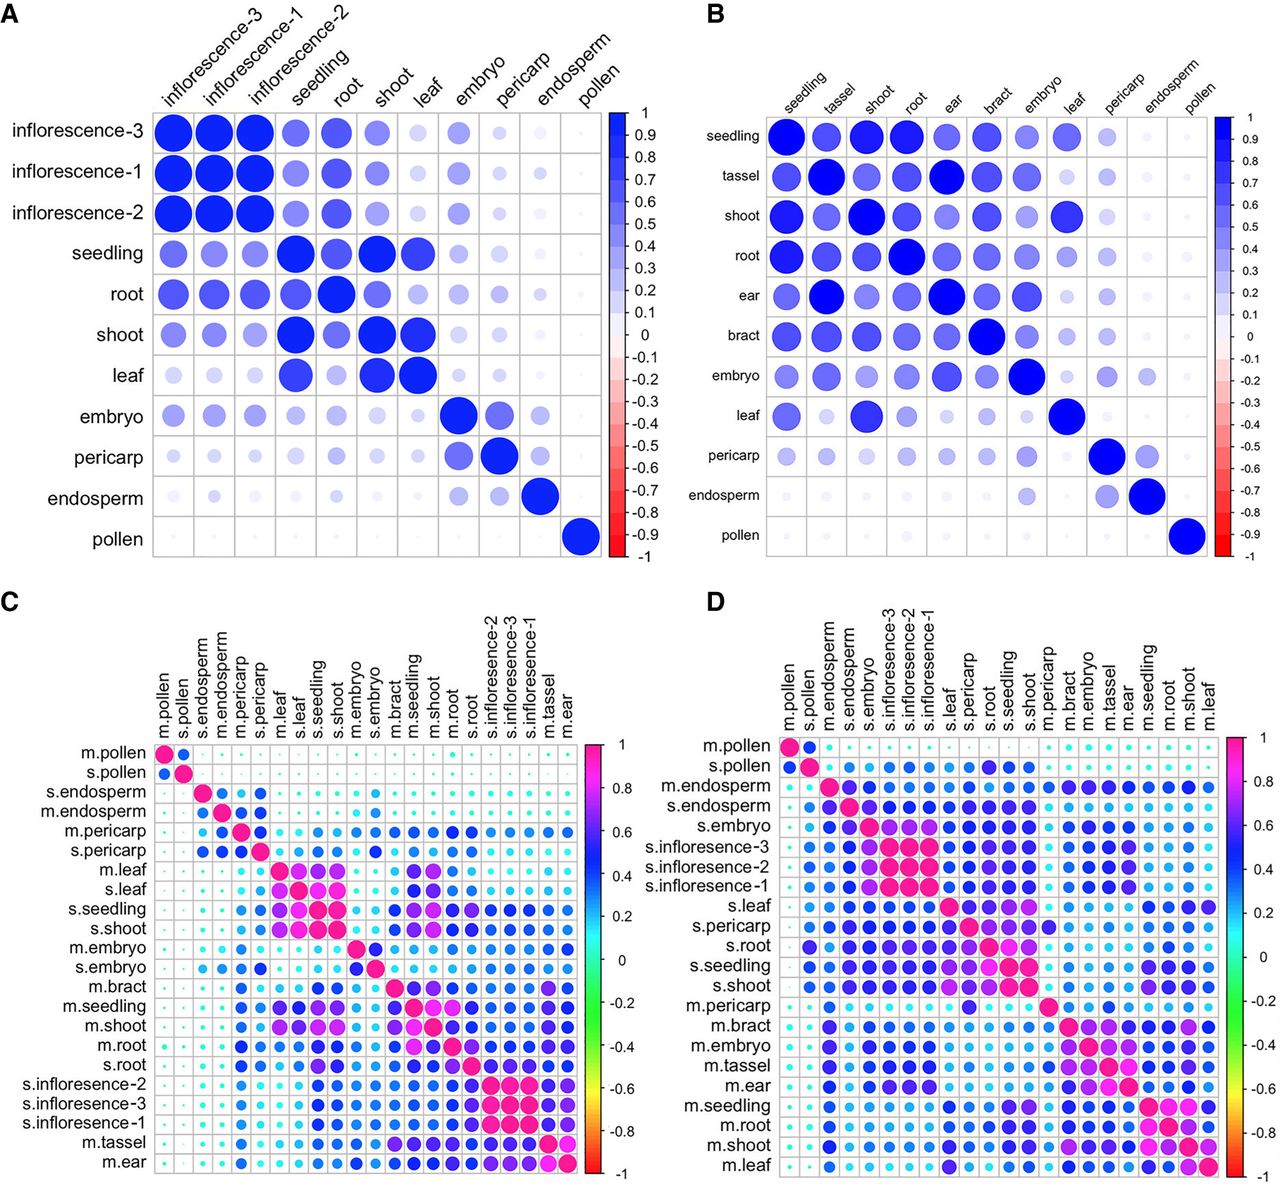
Figure 6.
Correlation matrix of genes among tissues, within and between species. Correlation matrices of the following: (A) gene expression among tissues in sorghum, (B) gene expression among tissues in maize, (C) gene expression among tissues between maize and sorghum, and (D) transcription factor expression among tissues between maize and sorghum.


