
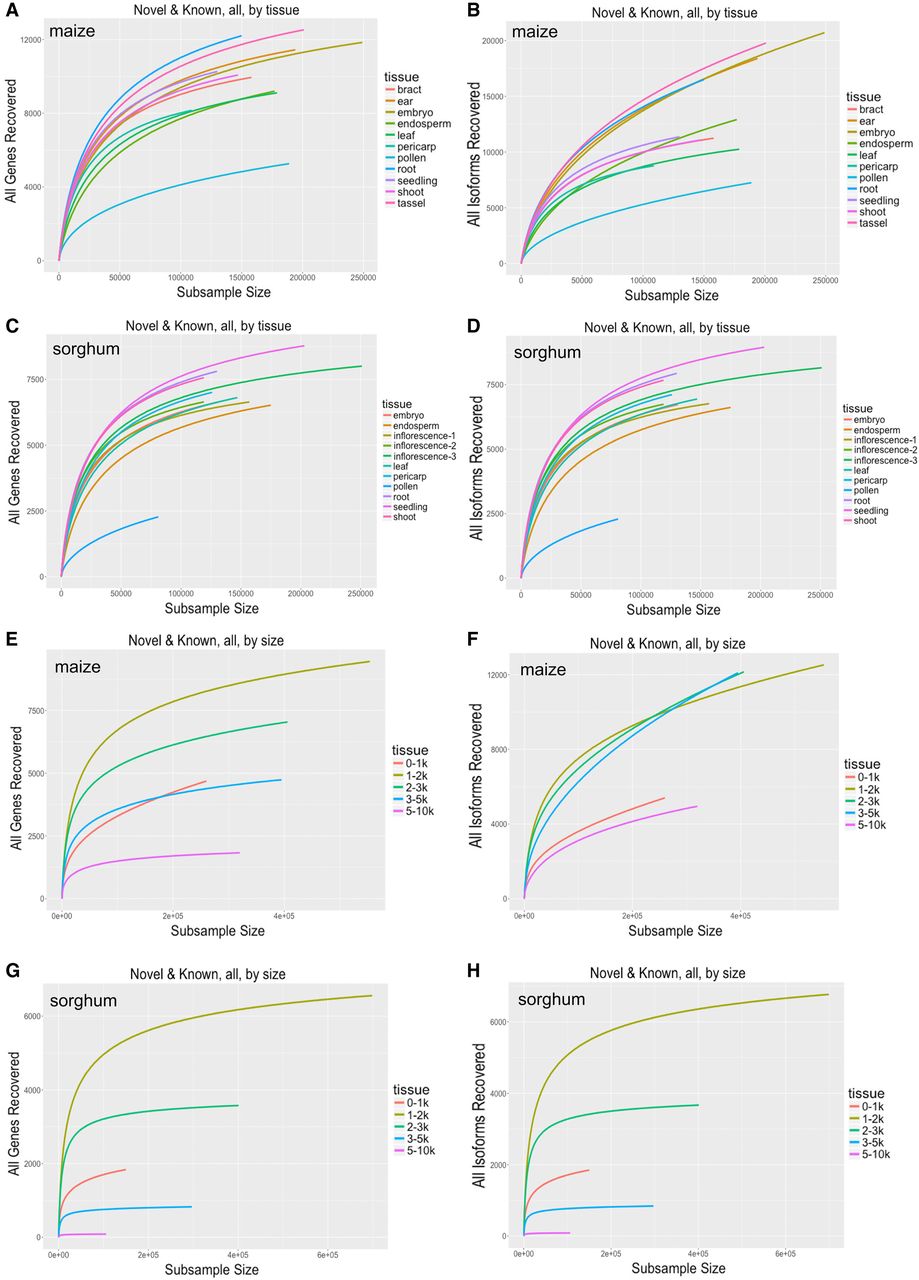
Figure 3.
Rarefaction analysis of covered genes/isoforms in maize and sorghum. Rarefaction analysis of the following: (A) covered genes in maize tissues, (B) covered isoforms in maize tissues, (C) covered genes in sorghum tissues, (D) covered isoforms in sorghum tissues, (E) covered genes in maize across size-fractionated libraries, (F) covered isoforms in maize across size-fractionated libraries, (G) covered genes in sorghum across size-fractionated libraries, and (H) covered isoforms in sorghum across size-fractionated libraries.


