
Figure 2.
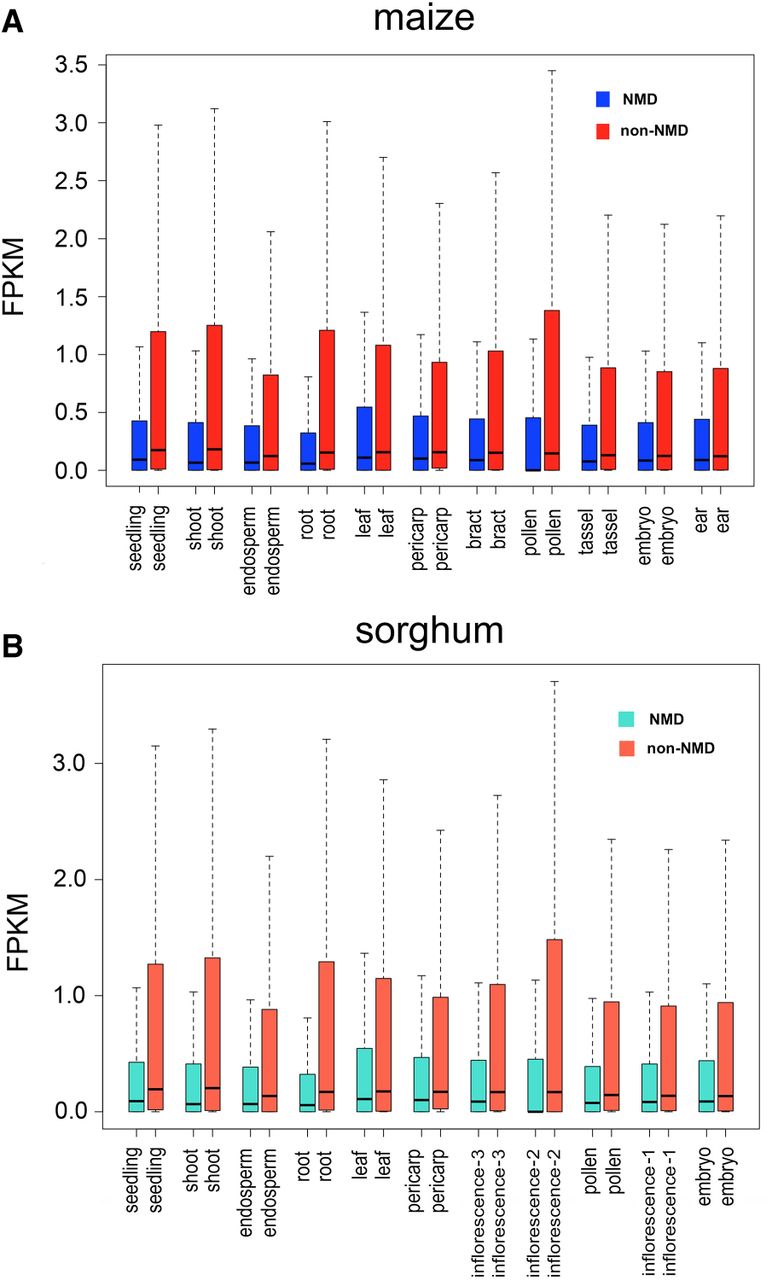
Comparison of expression levels between NMD and non-NMD isoforms. Comparison of expression level between NMD and non-NMD isoforms among tissues in maize (A) and sorghum (B).
(Downloading may take up to 30 seconds. If the slide opens in your browser, select File -> Save As to save it.)
Click on image to view larger version.
Comparison of expression levels between NMD and non-NMD isoforms. Comparison of expression level between NMD and non-NMD isoforms among tissues in maize (A) and sorghum (B).
 CiteULike
 Delicious
 Digg
Digg Facebook
 Google+
 Reddit
 Twitter
