
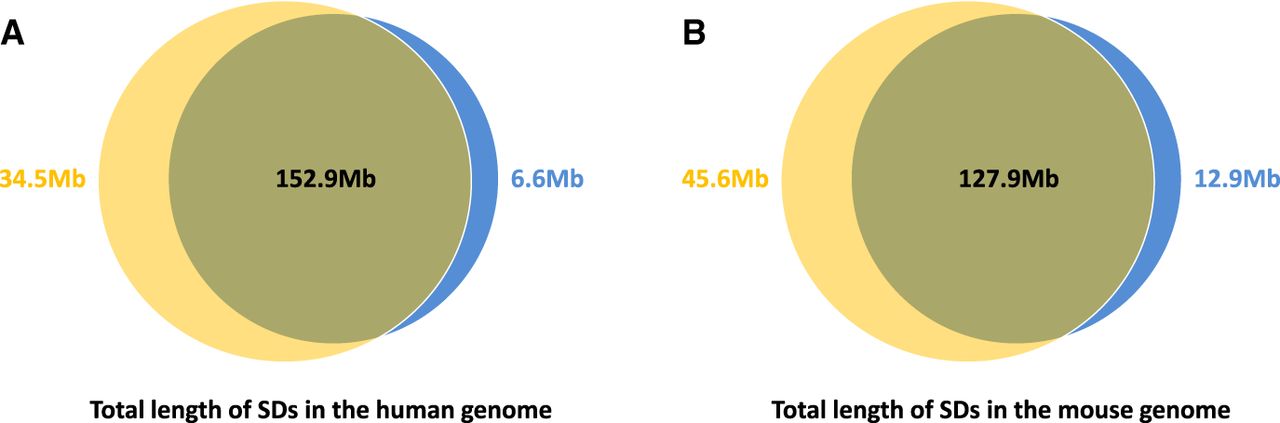
Figure 4.
The comparison between known SDs (shown in blue) and SDs identified by SDquest (shown in yellow) in the hg19 assembly of the human genome (A) and the mm8 assembly of the mouse genome (B).
(Downloading may take up to 30 seconds. If the slide opens in your browser, select File -> Save As to save it.)
Click on image to view larger version.
The comparison between known SDs (shown in blue) and SDs identified by SDquest (shown in yellow) in the hg19 assembly of the human genome (A) and the mm8 assembly of the mouse genome (B).
 CiteULike
 Delicious
 Digg
Digg Facebook
 Google+
 Reddit
 Twitter
