
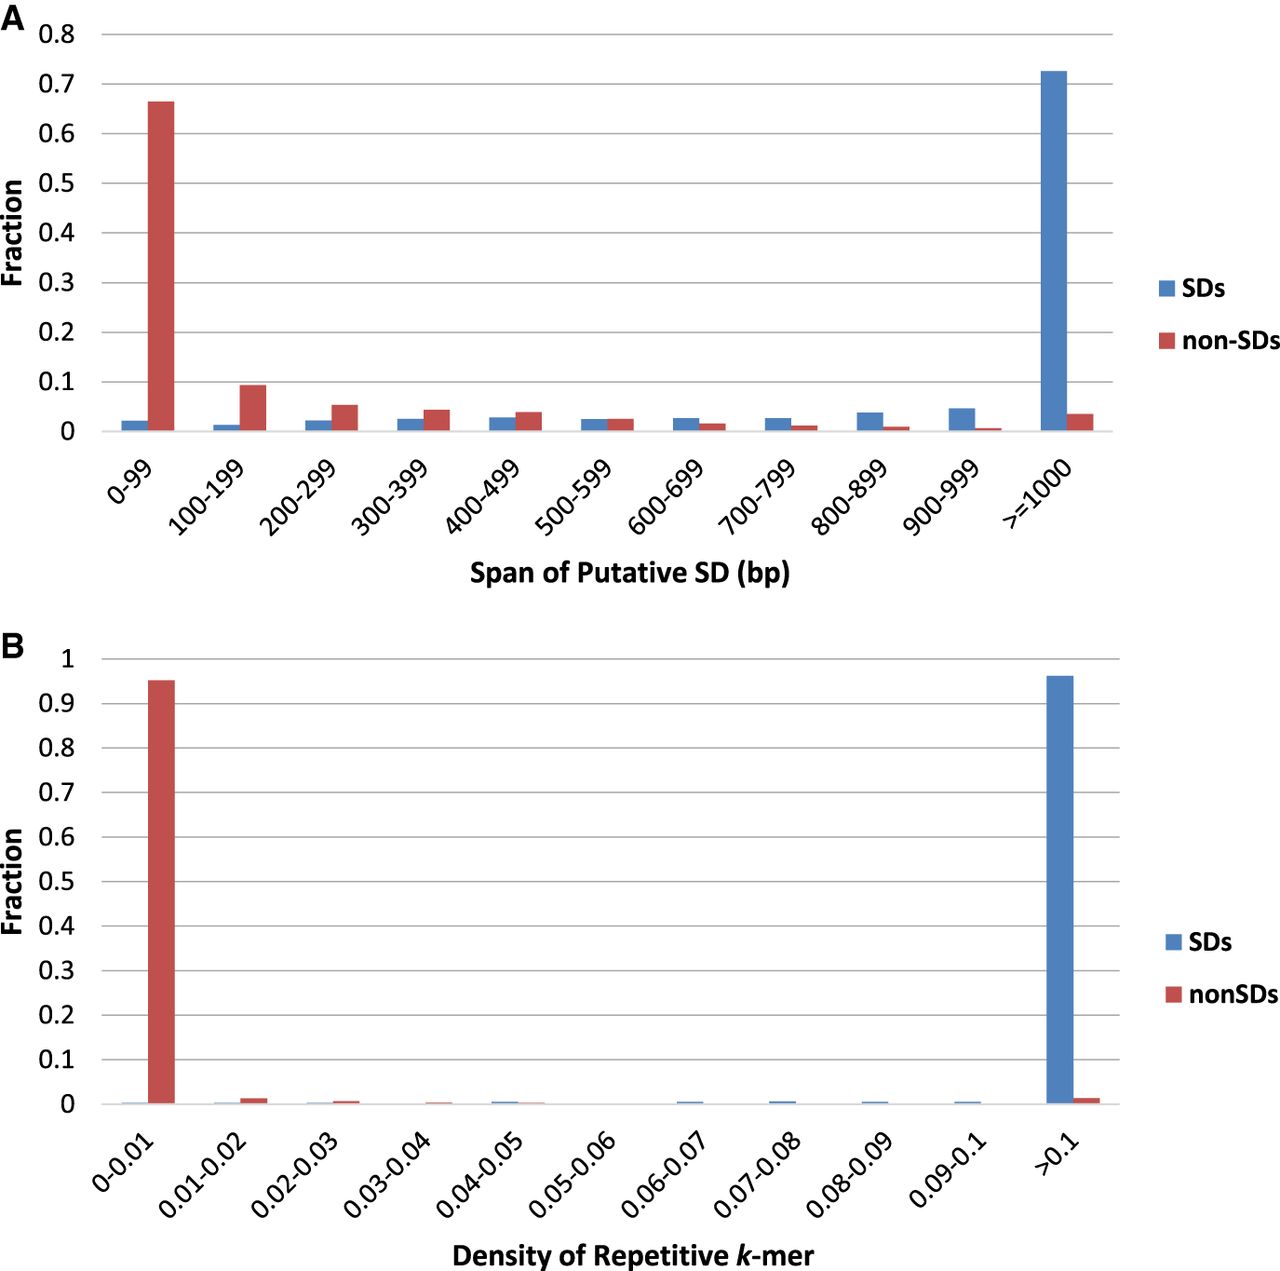
Figure 1.
The distribution of the span (A) and density (B) of putative SDs in known SDs (blue) and non-SDs (red) in the hg19 assembly of the human genome.
(Downloading may take up to 30 seconds. If the slide opens in your browser, select File -> Save As to save it.)
Click on image to view larger version.
The distribution of the span (A) and density (B) of putative SDs in known SDs (blue) and non-SDs (red) in the hg19 assembly of the human genome.
 CiteULike
 Delicious
 Digg
Digg Facebook
 Google+
 Reddit
 Twitter
