
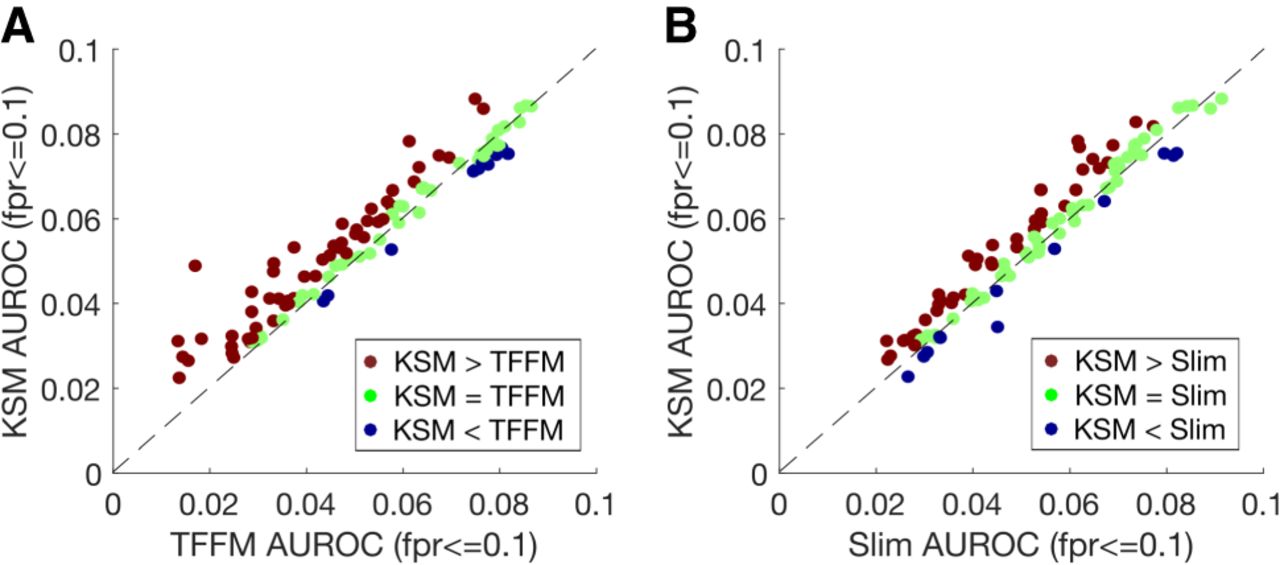
Figure 4.
KSMs outperform complex motif models in predicting in vivo TF binding. (A) Scatter plot comparing the mean partial AUROC (FPR ≤ 0.1) values of KSM and TFFM for predicting in vivo binding in 104 TF ChIP-seq experiments. Each point represents a ChIP-seq data set. (B) Similar to A, but comparing KSM and Slim.


