
Figure 5.
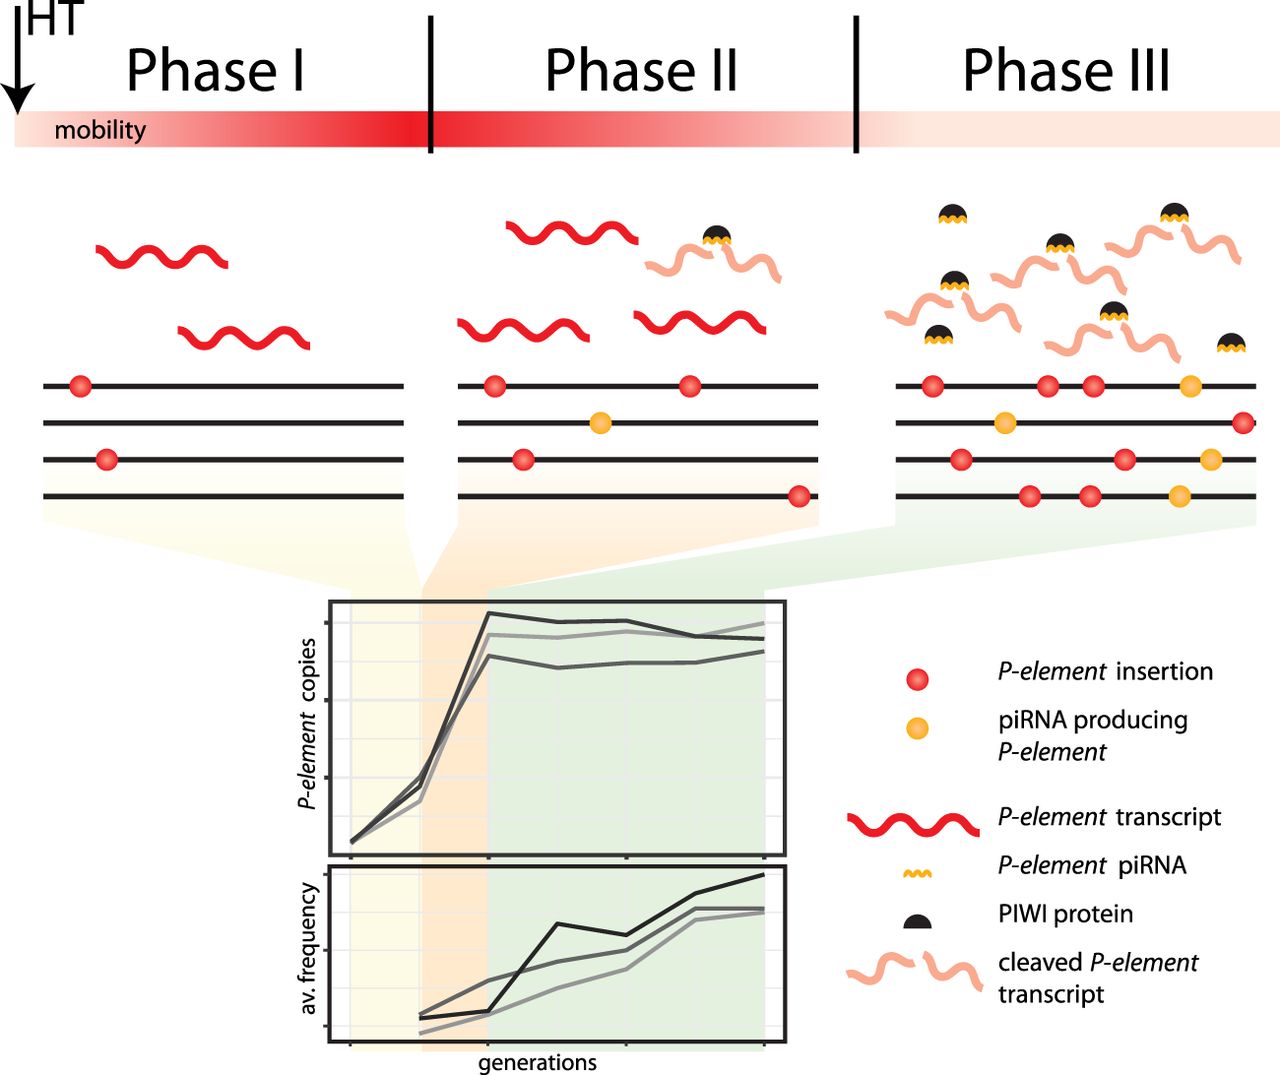
Shotgun silencing model of the P-element invasion. The heatmap indicates mobility of the P-element. (av. frequency) average population frequency of the P-element insertions.
(Downloading may take up to 30 seconds. If the slide opens in your browser, select File -> Save As to save it.)
Click on image to view larger version.
Shotgun silencing model of the P-element invasion. The heatmap indicates mobility of the P-element. (av. frequency) average population frequency of the P-element insertions.
 CiteULike
 Delicious
 Digg
Digg Facebook
 Google+
 Reddit
 Twitter
