
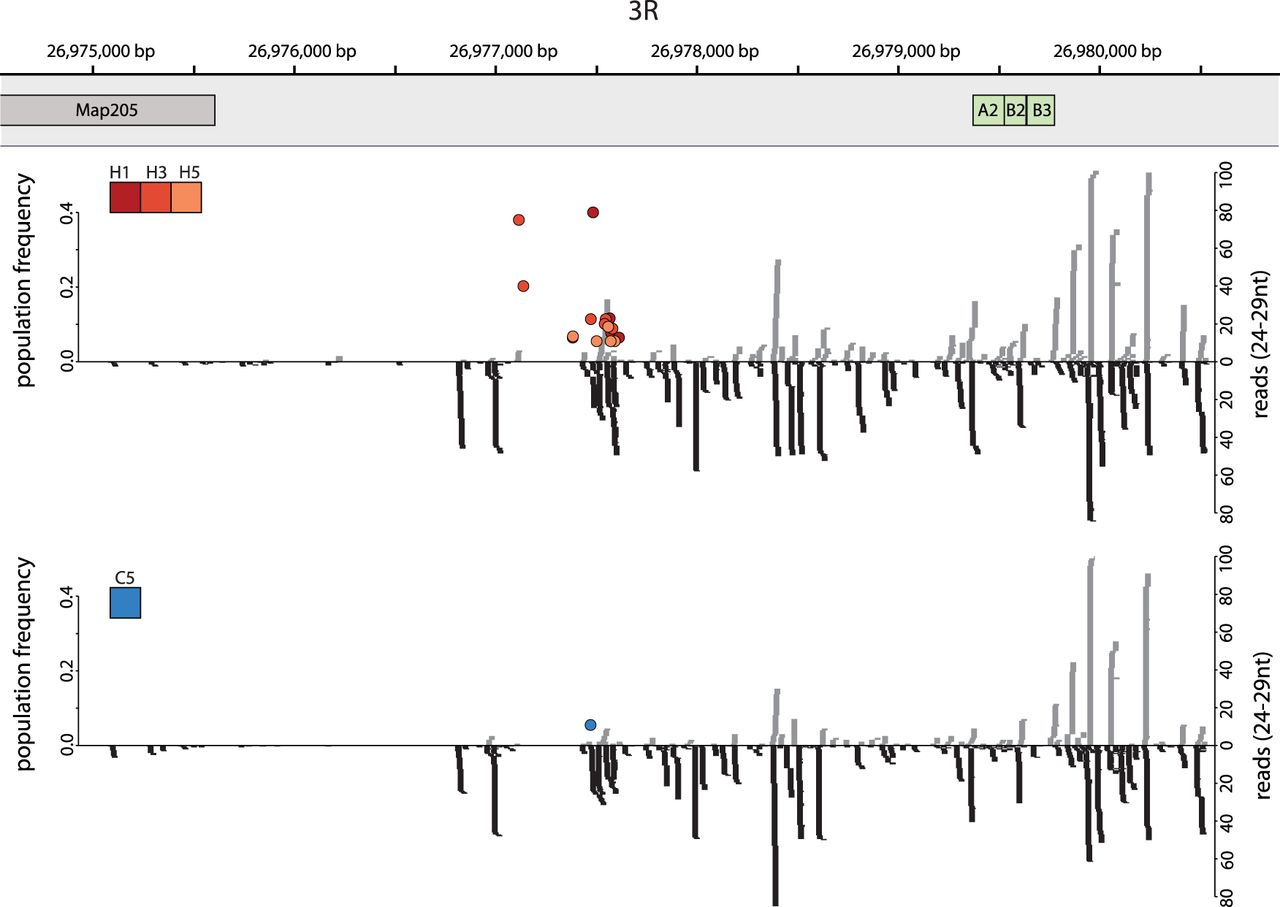
Figure 4.
P-element insertions in a piRNA cluster at the distal end of Chromosome 3R. The positions of P-elements (colored dots, with color indicating the replicate) are shown for hot (top panel; replicates H1, H3 and H5) and cold conditions (bottom panel; replicate C5). The positions of the telomere proximal gene Map205 and of TAS specific repeats (A2, B2, B3) (Asif-Laidin et al. 2017) are indicated. The abundance of piRNAs is shown on the right y-axis, and the population frequency of P-element insertions is shown on the left y-axis. Sense piRNAs are shown in gray and antisense piRNAs in black.


