
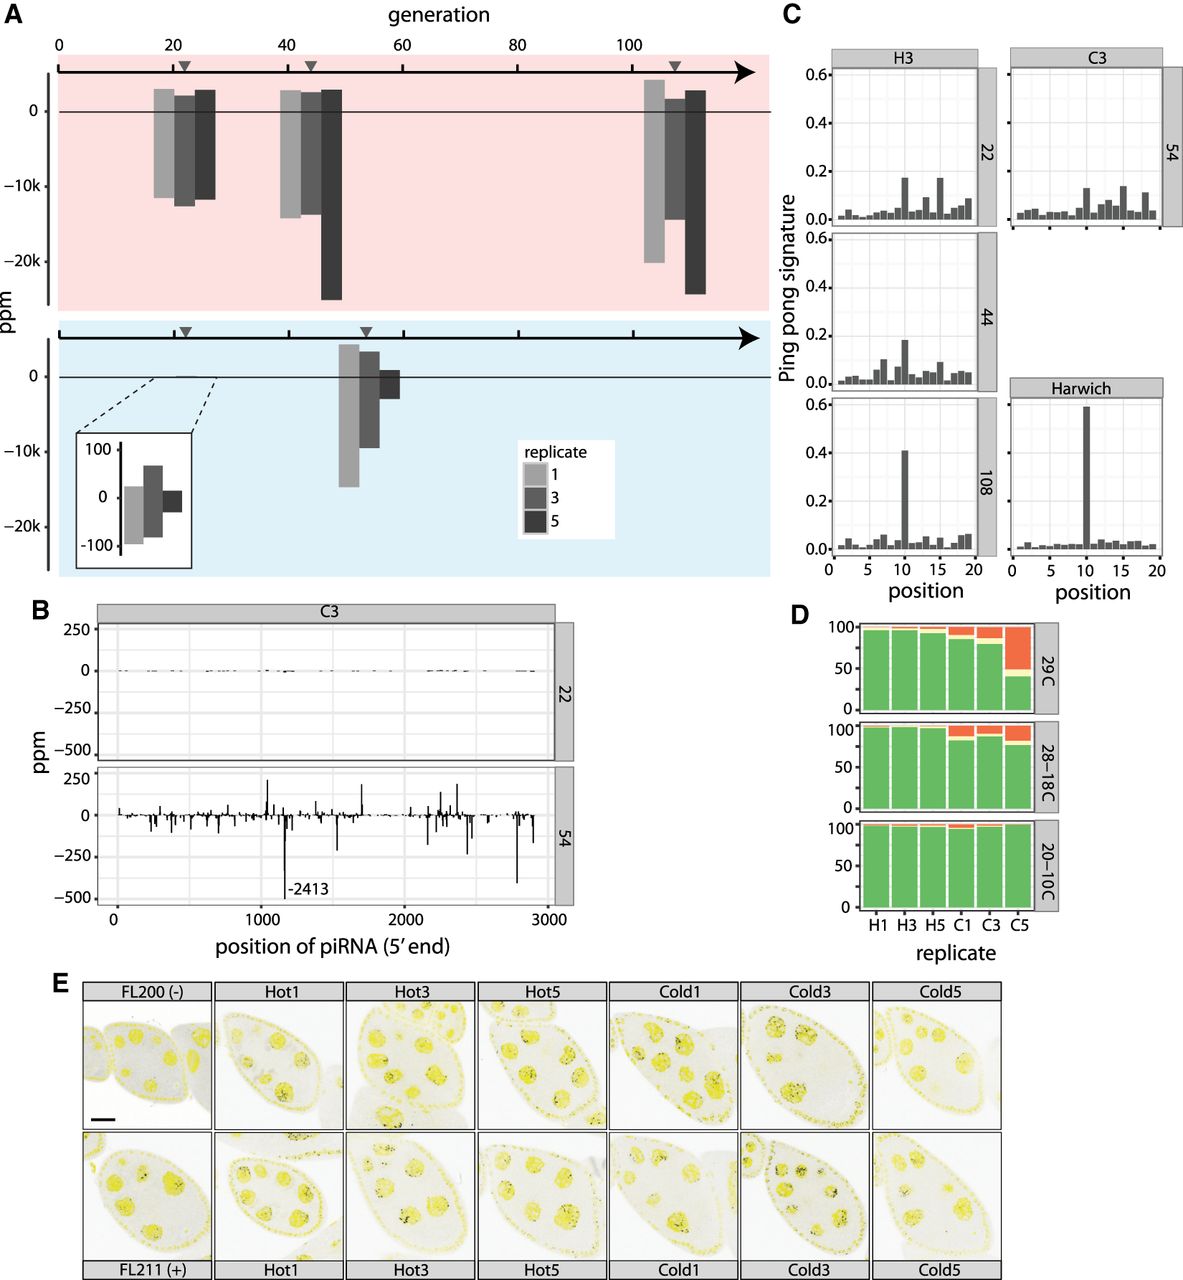
Dynamics of piRNAs during the P-element invasion. (A) Abundance of piRNAs complementary to the P-element during the hot and cold invasion in ppm (piRNAs per million miRNAs). Sense piRNA are on the positive y-axis, and antisense piRNAs on the negative y-axis. Gray triangles indicate the time of sequencing of small RNA libraries. (B) Abundance of piRNAs along the P-element during the cold invasion (replicate 3). Only the 5′ position of a piRNA is considered. A large peak at position 1164 was truncated. (C) Ping-pong signature of P-element piRNAs during the invasion (replicate 3). The ping-pong signature of D. melanogaster strain Harwich is shown for comparison (data from Brennecke et al. 2008). (D) Abundance of dysgenic ovaries at different temperature regimes for hot (H1, H3, H5) and cold (C1, C3, C5) evolved populations. A constant temperature of 29°C is generally used to test for dysgenic ovaries. Temperatures cycling between 28°C and 18°C and between 20°C and 10°C reflect conditions of our experimentally evolving populations: (green) normal ovaries; (red) dysgenic ovaries; (yellow) intermediate. (E) Antisense transcripts of the P-element are expressed in D. simulans ovaries. We dissected flies from the hot invasion (Hot) at generation 108 and from the cold invasion (Cold) at generation 54 and used single RNA-FISH to detect antisense transcripts of the P-element (black dots). DAPI is shown in yellow. As positive (+) and negative controls (−), we included ovaries from flies with and without the P-element (Hill et al. 2016). Scale bar, 20 µm.


