
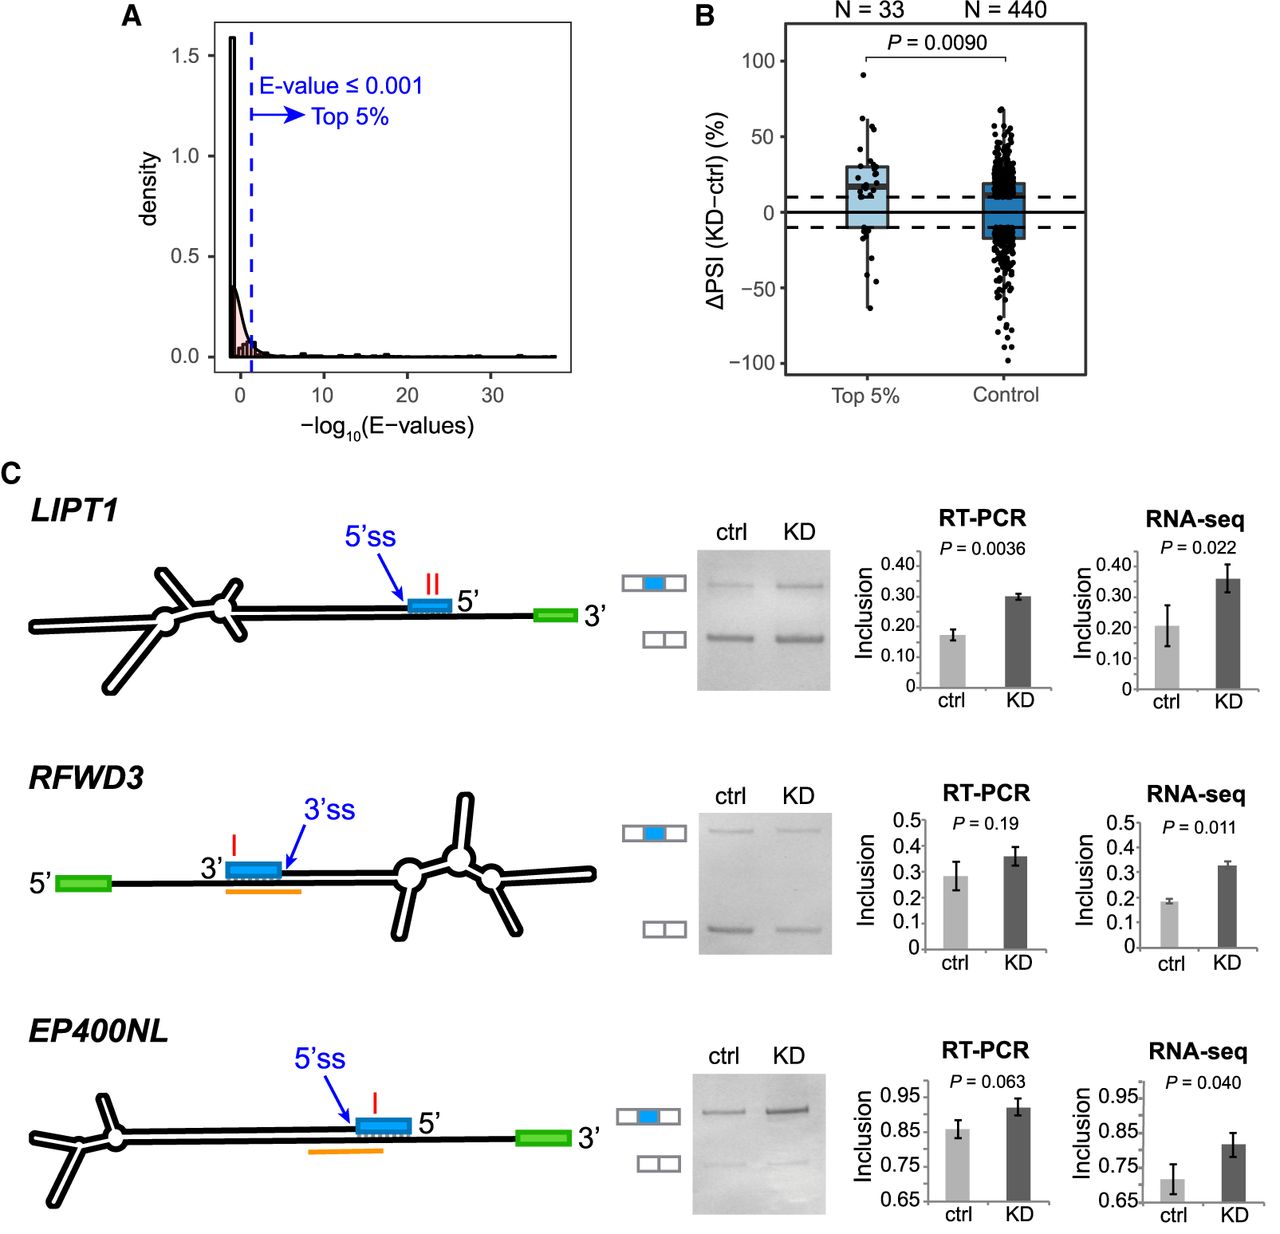
Regulation of splicing by ADAR acting on dsRNA structures. (A) E-value distribution of BLASTN alignments between exon and intron sequences, for exons with ≥10% PSI change upon ADAR1 KD. A total of 33 exons (top 5% of all) had E-value ≤0.001 (blue dashed line). (B) Box plot of PSI changes (ΔPSI) upon ADAR1 KD, for the 33 exons in A, and control exons with E-value >10 in the BLASTN analysis. Each dot represents an exon. The dashed lines mark ΔPSI = ±10%. The number of exons in each group is shown. P = 0.0090 comparing ΔPSI values of the two groups (Wilcoxon rank-sum test). (C) Experimental testing of endogenous splicing changes by RT-PCR in ADAR1 KD and control U87MG cells. The mfold-predicted RNA secondary structures are depicted (not to scale): (blue box) candidate exon under regulation; (green box) a neighboring exon. ADAR1 CLIP peaks are highlighted in orange. The red letter “I” denotes the position of editing sites. Example gel images are shown using RT-PCR products generated by primers on the two flanking exons (white boxes next to the gel images). Mean and SD of exon inclusion levels based on three biological replicates of RT-PCR are shown. Mean and SD of PSI values derived from two biological replicates of RNA-seq are also shown. P-values were calculated by Student's t-test.


