
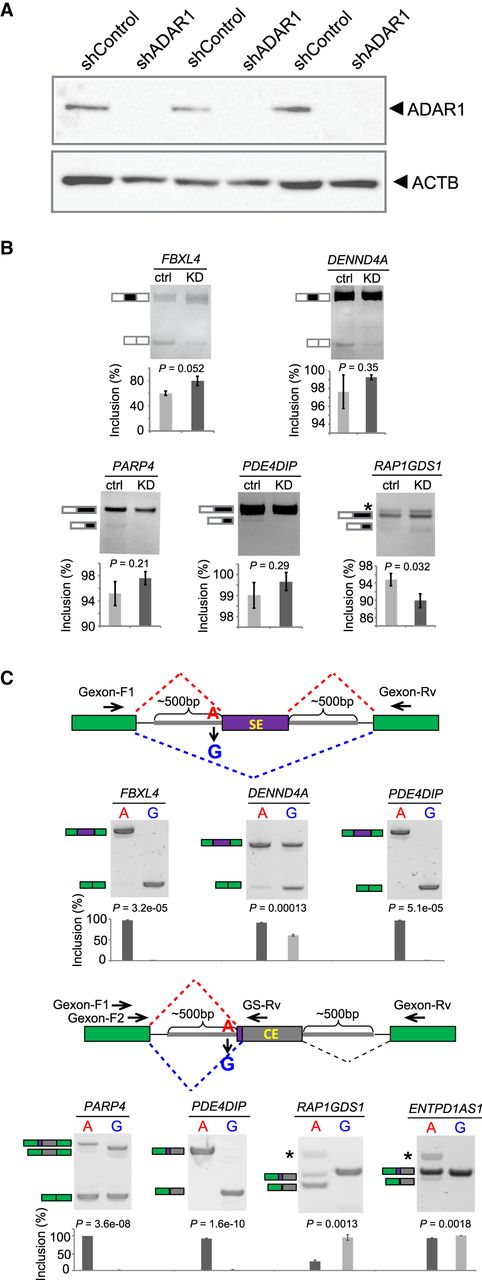
Experimental validation of splicing changes induced by 3′ss editing. (A) Western blot of ADAR1 in U87MG cells stably expressing control shRNA (shControl) or ADAR1 shRNA (shADAR1). Three biological replicates are shown. (B) RT-PCR results of endogenous splicing levels of five randomly chosen exons with 3′ss editing. U87MG cells in A were used. (Ctrl) shControl; (KD) shADAR1. Exon inclusion levels (%) were calculated based on triplicated experiments. One example gel image is shown. Error bars represent standard deviation. P-values were calculated by Student's t-test. (C) Seven randomly chosen editing-dependent alternative splicing events were validated in minigene systems. The minigene designs to validate exon skipping (top) and alternative splice site events (bottom) are shown, respectively. Primers used to amplify the splicing products are shown as arrowheads. In the bottom diagram, Gexon-F1 and Gexon-Rv represent the forward and reverse primers used for PARP4. Gexon-F2 and GS-Rv refer to the forward and gene-specific reverse primers for the other three exons. Exon inclusion levels (%) were calculated based on triplicated experiments. One example gel image is shown. Error bars represent standard deviation. P-values were calculated by Student's t-test.


